

Executive Summary
The home service market gained a new level of awareness and popularity following the overwhelming impact of COVID-19 on human welfare and overall economic growth.
As people retreated to their homes, consumer spending followed and there was an unexpected boom of economic activity around the home. This shift in spending to the home from activities like eating at restaurants or traveling, combined with existing strong demographic, economic, and cultural tailwinds has resulted in considerable growth in the size of the total addressable home service market.
No longer are homes strictly assets we use to force us to save—they are the new center of our personal and professional lives. Home spending decisions are more and more being driven not only by pressing maintenance repairs, but now also by enjoyment, utility and lifestyle.
Our recent research on consumers captures this strong pivot of consumer spending to the home, but what are the implications for the market as a whole? It does not necessarily follow that spending changes by the average homeowner directly map to changes in the size of the market, because the market size overall is a function of average consumer spending, the composition and number of consumers, and more.
In this second edition of our annual home service market report, we look at the size of the market and examine how the status of our housing stock and the current attributes of our demographics shape home service demand, as well as how the market has grown as a result.
The housing stock continues to age, with the average age of a home now over 40 years old, and continuing to age as the rate of new home construction – between 500,000 and 1,500,000 new units per year – is not enough to bring down the average age of the 141,500,000 existing housing units.
Conversely, the younger millennial generation is hitting its peak homebuying age (early 30s), meaning a new influx of homeowners looking for their dream home is putting upward pressure on the demand for remodeling.
This report is a distinct look at where the market is strongest, the people who compose it, what’s driving topline spending, how it’s changed from last year, and what we can expect in the years to come.
Mischa Fisher
Chief Economist, Angi Inc.
Key Takeaways
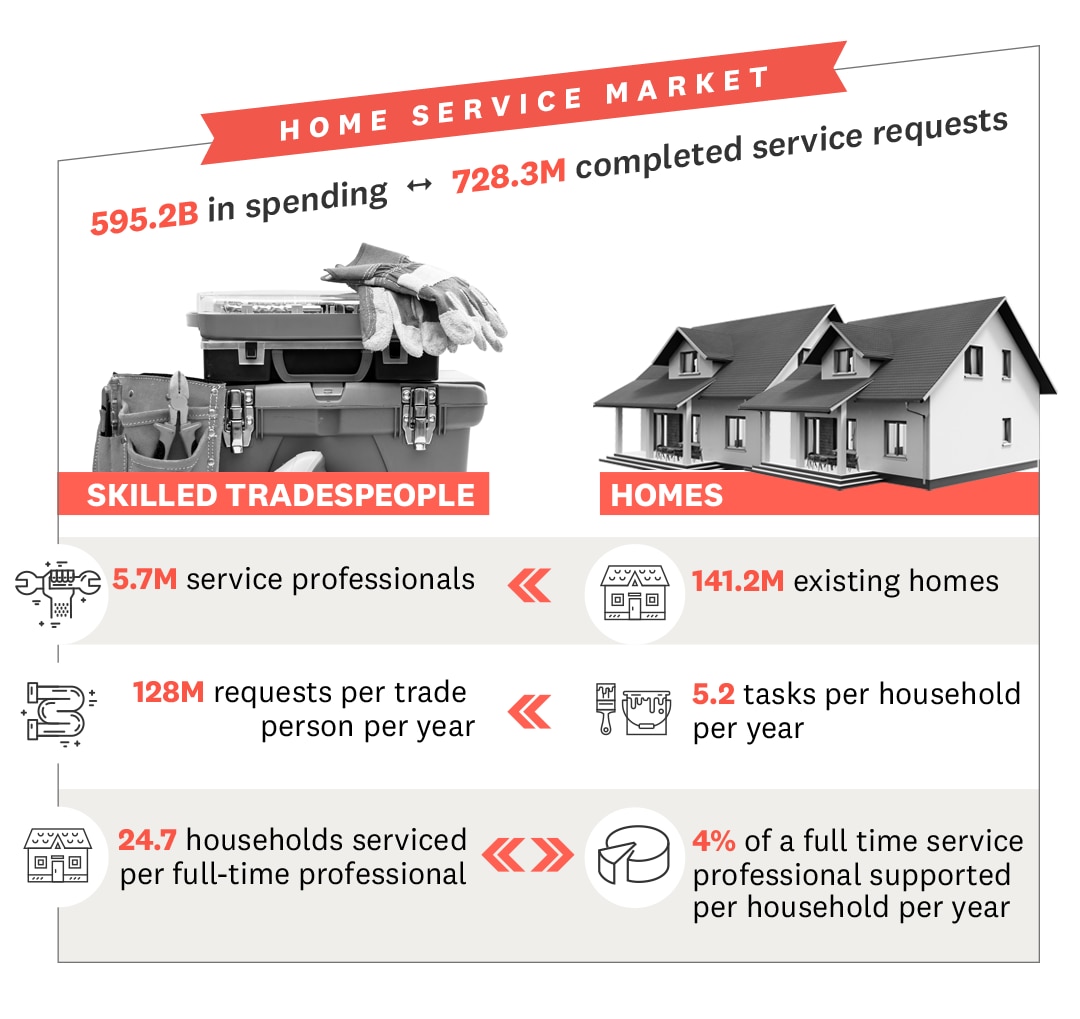
Increased consumer spending on remodeling, combined with an unexpected jump in home equity, more household cash flow due to mortgage refinancing, spending substitutions due to reduced spending on restaurants and vacations, cheap loans due to lower interest rates, and a spike in prices and inflation due to Covid-19, has resulted in a 17% increase in the total addressable market (TAM) for home services, growing from $506 billion to $595 billion. Households are completing 728.3 million projects per year across the three market categories: home improvement, home maintenance and home emergency repairs.
- The number of home service pros is estimated at 5.8 million.
- There are 141.5 million housing units with a median structure age of 43 years. The total housing stock is rising as new units are built to accommodate the growing population, however, new construction rates of even a million new units per year are not enough to prevent the average age of homes to continue rising.
- There are 331 million people living in 128 million households, with an average of 2.5 people per household.
- The median age for the population is 38, with large cohorts of millennials and boomers currently entering the stages of life focused on home buying and aging in place, respectively.
- Further growth in spending can be expected in the market given rising input prices, low interest rates, home equity gains and demographic trends.
Part 1: Home Service Market Drivers: Housing and Demographics
Demand for home services and the requisite spending that follows is fundamentally driven by two things: houses and people.
The characteristics of the population shape home service demand as a direct function of how many people there are, their age, their preferences, the number of kids, teenagers, young professionals, working adults, and retirees, their different propensities to spend, and their unique preferences for the sorts of homes in which they want to live.
The housing stock in the U.S. is composed of the more than 140 million unique structures. Their age, size, shape and character all shape the demand for each category of home services.
To understand how the housing stock and demographics shape home service spending, we must look at the three distinct categories of the home service market: home maintenance, home improvement and home emergency repair.
Home improvement remains the category with the most cultural cache and attention. That’s no surprise: it is significantly more entertaining to watch a bathroom remodel than the unclogging of a toilet. However, home maintenance and home emergency repairs are similarly critical parts of the market. Home improvement is particularly shaped by demographic needs and preferences, while home maintenance and emergency repairs are more a function home age, size, location and other attributes.
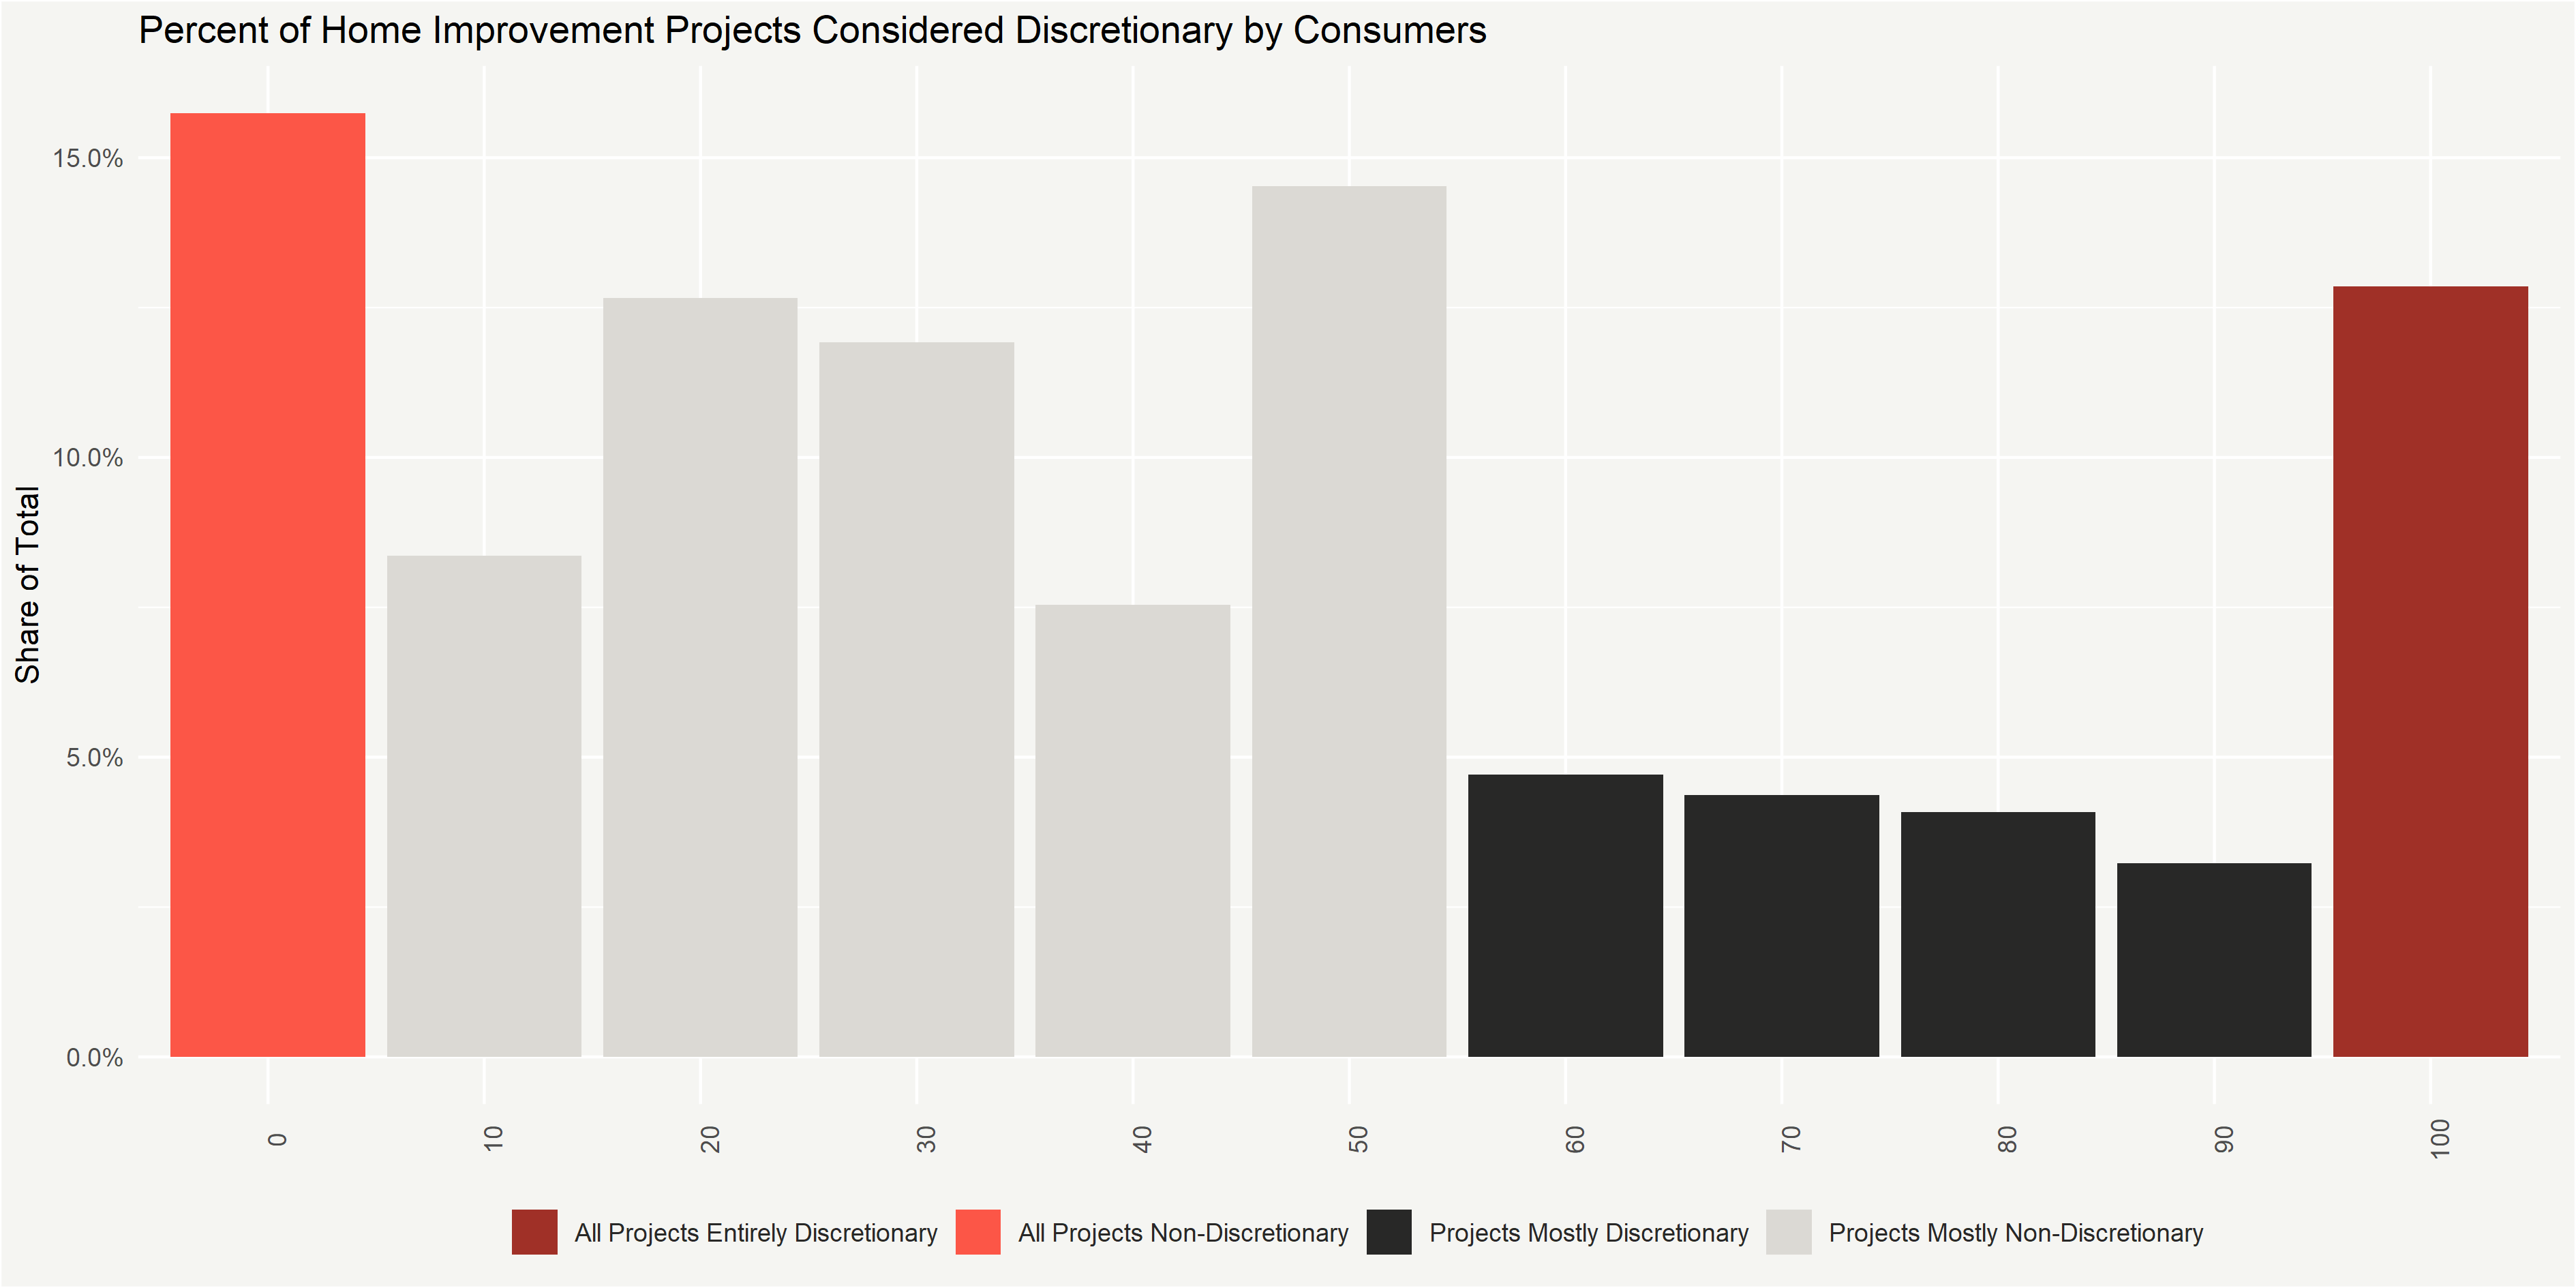
Where home improvement is heavily discretionary, home emergency repairs and home maintenance are less optional and tend to be more urgent in nature.
Surprisingly, while improvement is more optional than maintenance or emergency repairs in the eyes of the households purchasing these services, an unexpectedly large number of households list their improvement projects as not entirely optional. Only 40% of improvement projects are considered “entirely optional” by households undertaking these services, suggesting that, even though improving the functionality and style of one’s kitchen is not as outwardly pressing as fixing a leaking roof, consumers still view many improvements as necessary lifestyle projects.
Using similar survey1 data for the full general population of the United States allows us to not only understand how consumers prioritize their spending, but also to estimate the total size of the home service market.
The housing stock covers the types of structures people live in, their materials, their locations, their age and their size, among many other attributes. Each of these will have an impact on shaping home service spending for years to come.
For example, if a roofing system with a 40-year lifespan was popular in 1980s home construction, then the current demand to replace it might be high for the 10-20 million homes built during that decade. Alternatively, if a certain style of cabinet was popular in the 1990s, then demand to refinish them may have spiked in the 2000s as fashions evolved and preferences changed.
While the complexity of every given era and region’s building preferences, materials and fads goes far beyond the scope of a single report, the raw number of homes is more straightforward, captures some of the principle involved and is the first important component determining the size of the home services market.
1.1 How Home Characteristics Shape Home Service Demand
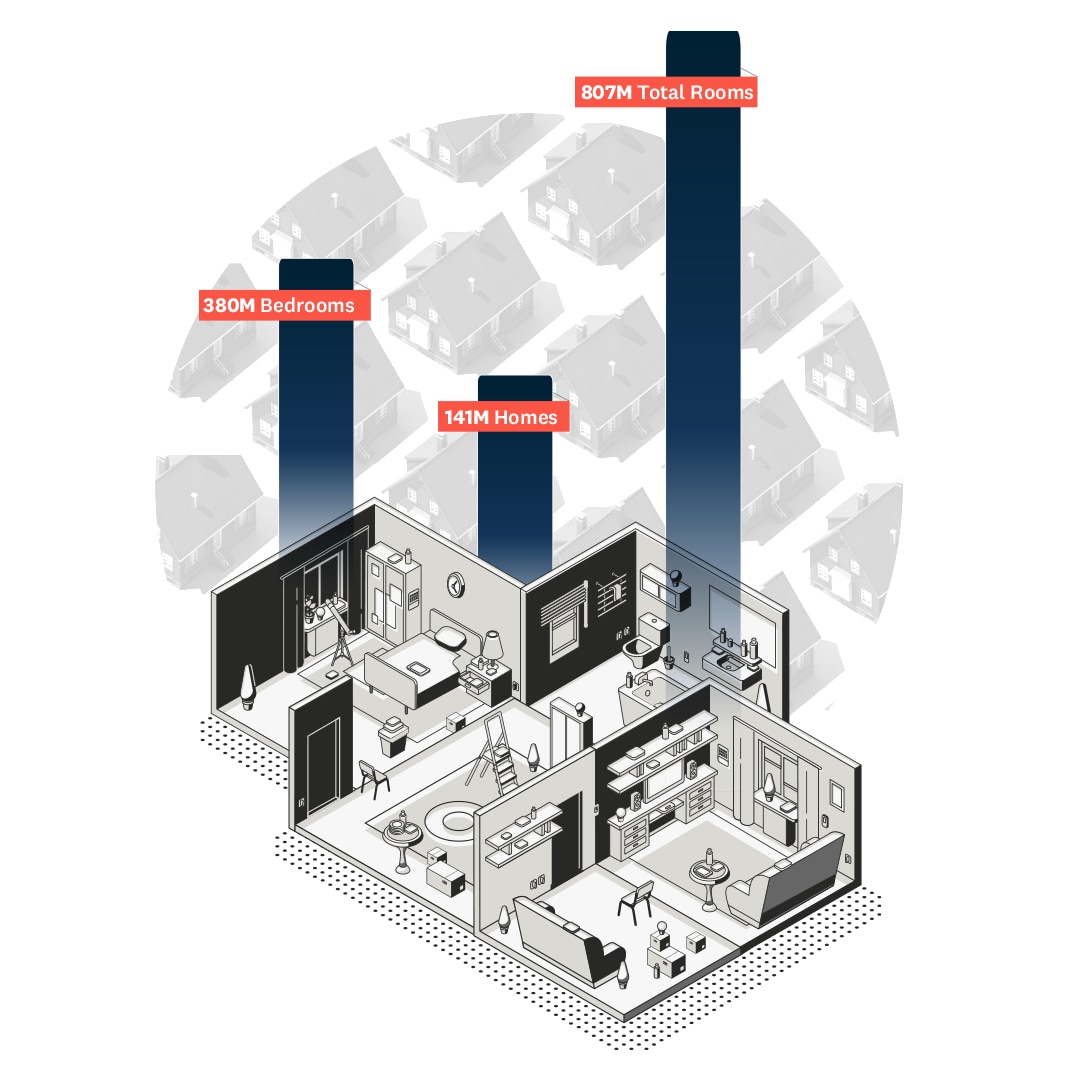
There are 141.5 million homes in the United States.
Collectively, this adds up to 380 million bedrooms, and over 807M total rooms.
This is a staggering amount of constructed environment and physical material that undergoes constant wear and tear from both occupants and the environment.
This total supply of rooms reflects the diversity in all the ways we live. It’s composed of bedrooms, kitchens, bathrooms, mud rooms, laundry rooms, finished basements, reading nooks, entryways and family rooms, each with their own flooring, interior and exterior siding, ceilings, paint, fixtures, outlets, plumbing, doors and windows.
For example, a 10’ by 10’ room with 8’ ceilings has 320 square feet of wall space. 807 million rooms at this dimension would require 645.6 million gallons of paint to cover, enough to fill roughly 1,000 Olympic size swimming pools.
But not every home has an entryway, mudroom, dedicated laundry room, or even its own roof. Which is why the second big component of the housing market is the nature of the underlying structures that compose our 141.5M housing units.
People live in every type of structure imaginable, from modest ranch homes to sprawling mansions; from pre-fabricated homes to quiet suburban cul-de-sacs; from modern architectural wonders to classic brown-stone walkups; from rental apartment buildings to penthouse condominiums.
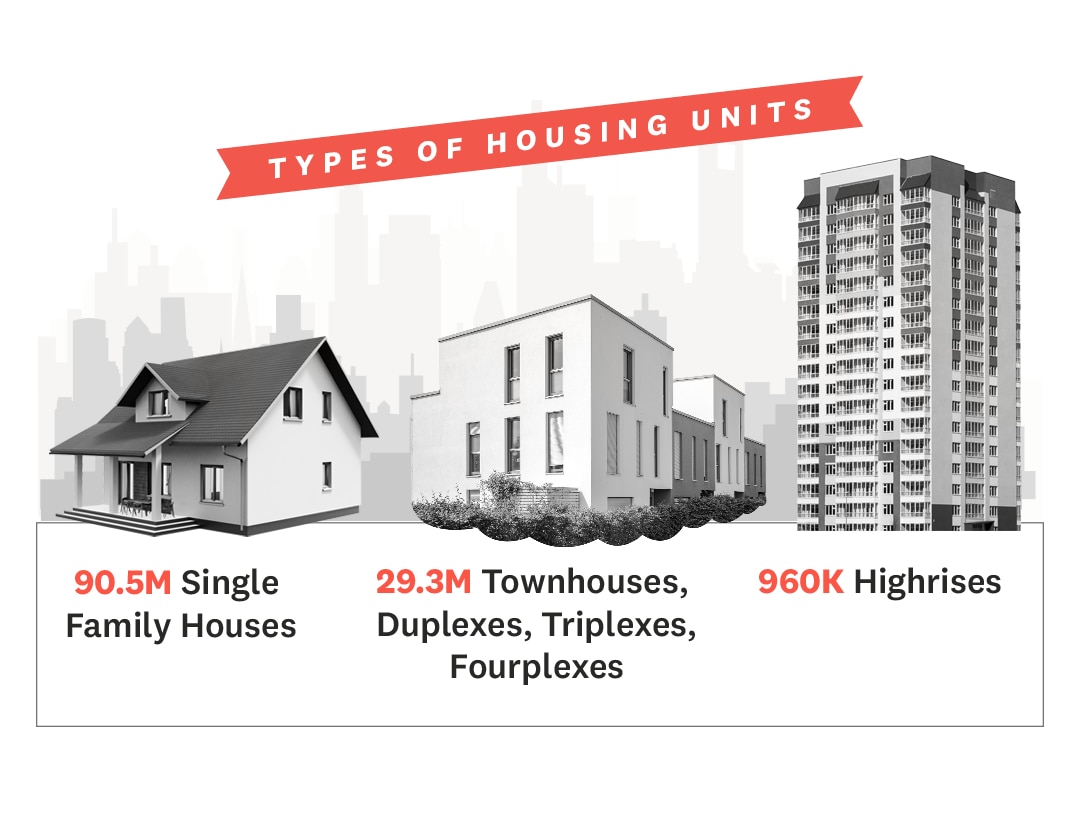
The major housing types are approximately 90.5 million single family homes, 29.3 million townhouses, duplex, triplex, and fourplex units, and 960,000 high-rise units. In addition to that there are millions of other types of living structures that fall under less common classifications.
The composition of the housing stock is a fundamental driver of how demand for home services is shaped, not only due to their underlying characteristics (for example, roof area, number of bathrooms, whether they have garages, etc.), but also because the composition of the housing stock changes over time, so the type of housing structures that exist in any given area trend with home age.
In addition to the number and composition of our housing stock shaping the final demand for home services, the age of the housing stock also has an impact.
All building materials have finite lifespans and need replacing, whether it’s paint, roofing, flooring, plumbing or electrical fixtures. In addition to upper limits based on the maximum longevity of building materials, styles also change over time as new trends replace old ones.
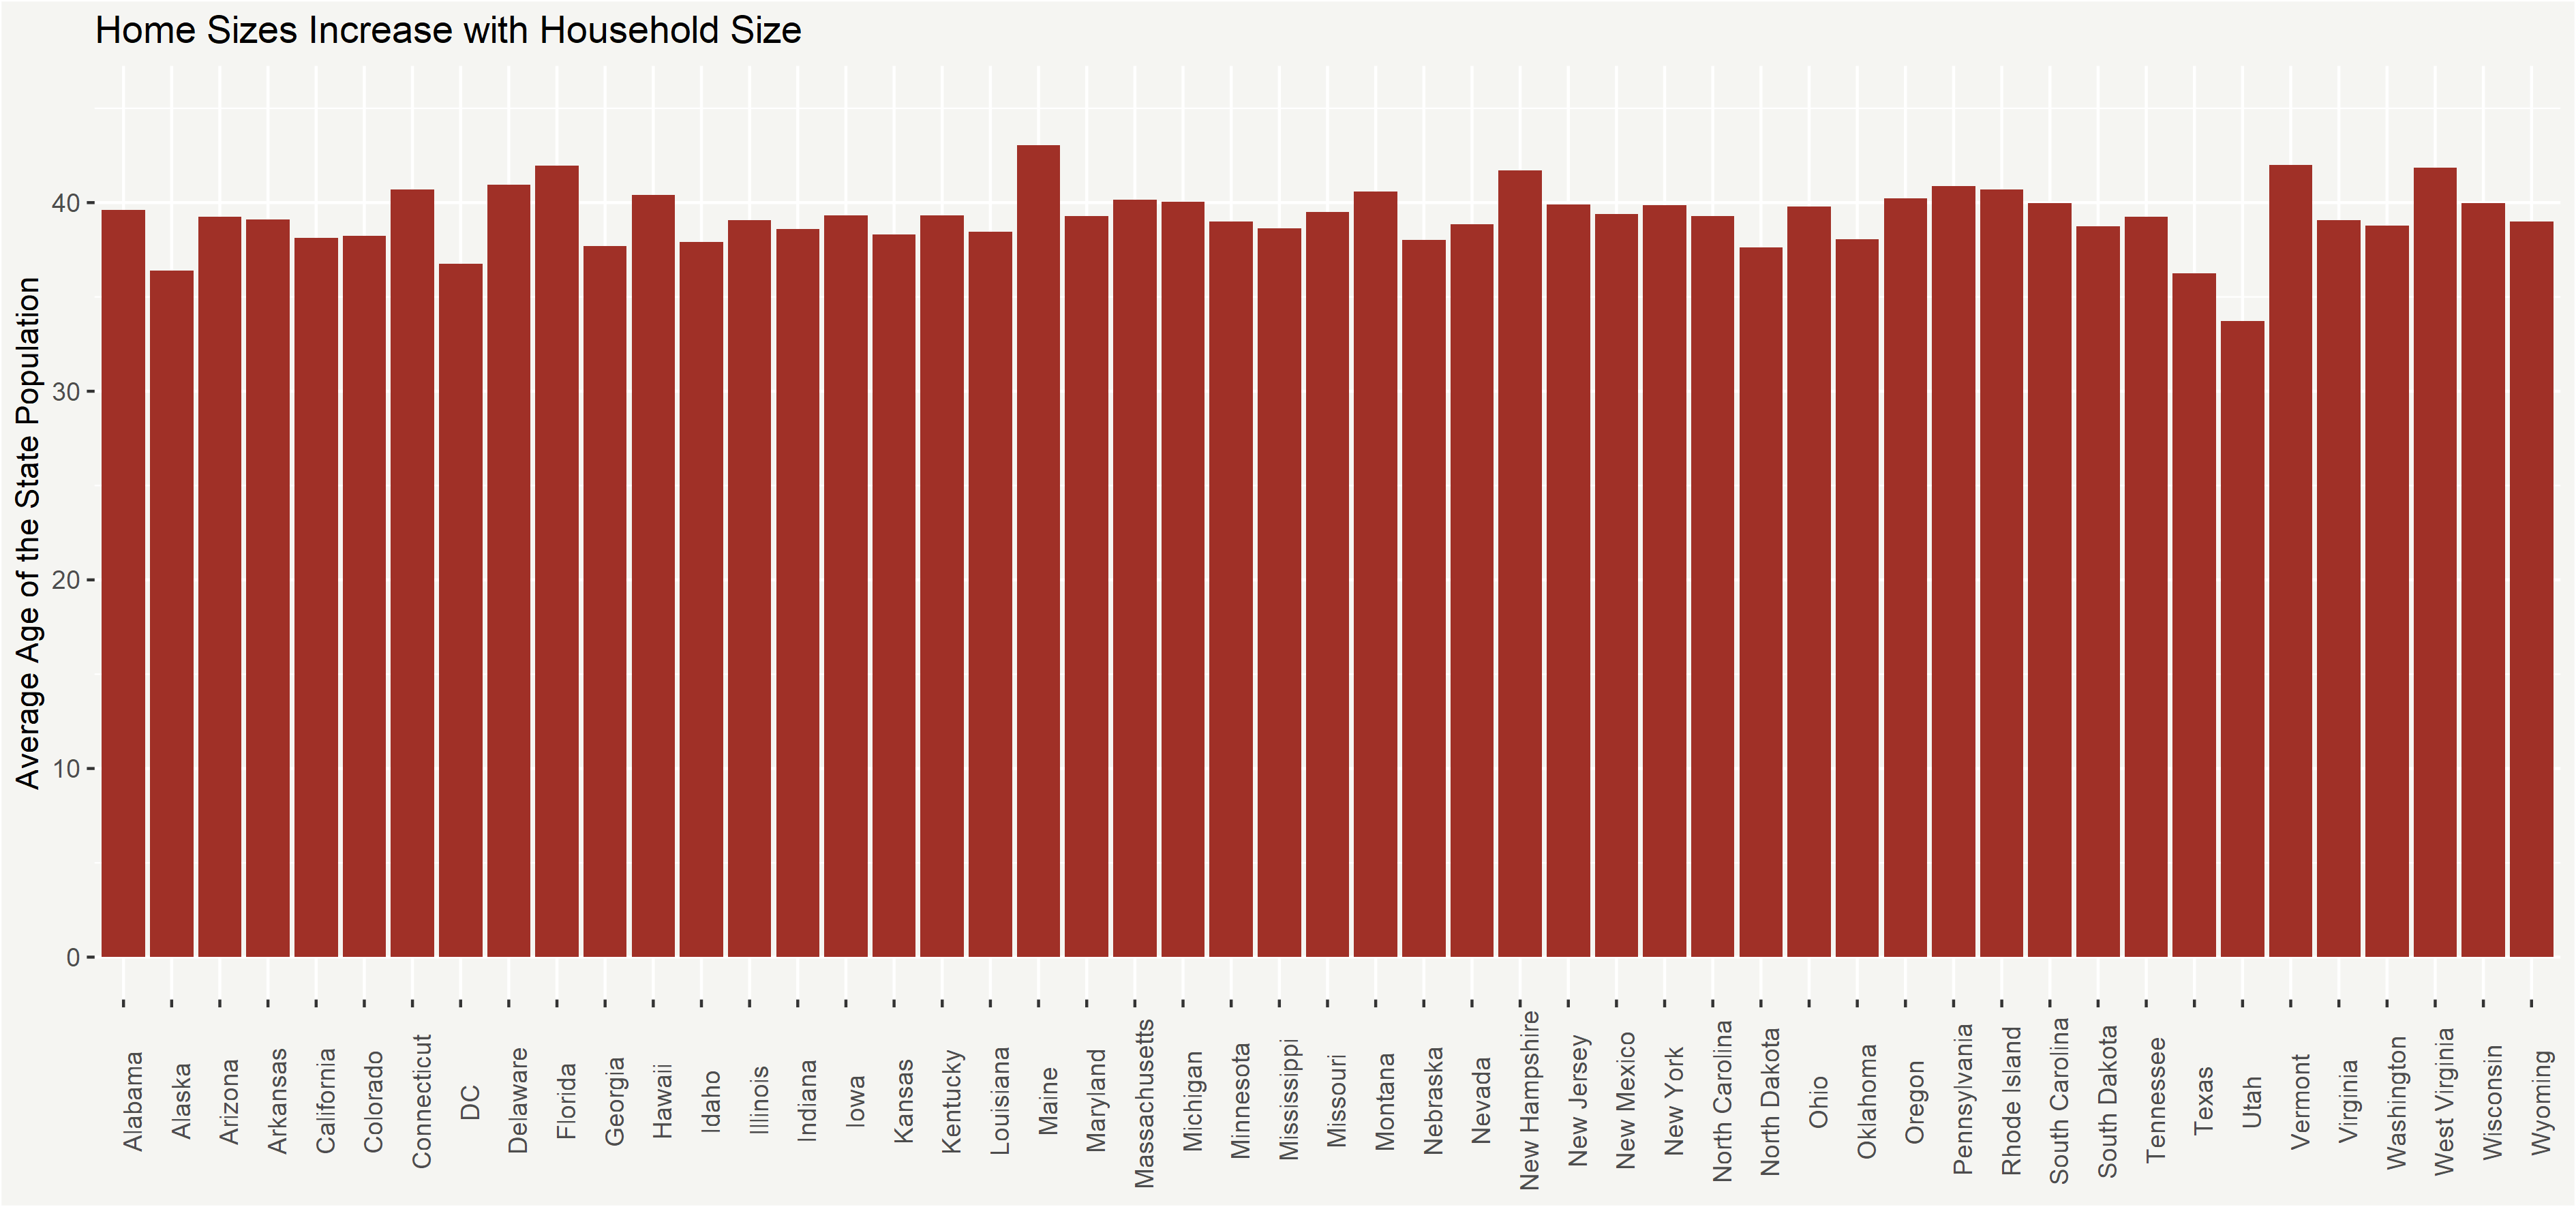
The median home age in the country is 43, but this average age masks the considerable variation by state.
For example, the state with the oldest homes is New York, with homes averaging nearly 60 years old, more than double the age of the youngest state Nevada, where the average home age is just 28.
Across different structure types, there is also considerable variation in age. This is a function of different structures being built in different locations, during different growth cycles and for different reasons. The median age for townhouses and apartments/high-rises is 34, while the median age for single family homes and other structures is 44.
In other words, nearly 40% of America’s housing stock was built before the 1970s and is more than 50 years old, and this plays a large part in shaping home service spending.
While it is not necessarily true that older houses require more spending in absolute terms, there is a relationship between home age and home spending. This is a function of both the trends and fashions when homes are built, as well as the building material costs for new homes and price appreciation of existing homes.
Home values vary by location as much as their ages, so while the average value of a house in the U.S. is $334,000, there is great variety around this due to concentrated areas of higher value homes.
The median home value is $230,000, ranging between a low of $150,000 for trailers and mobile homes, to $200,000 for single family homes, $325,000 for townhouses and $460,000 for high-rise units.
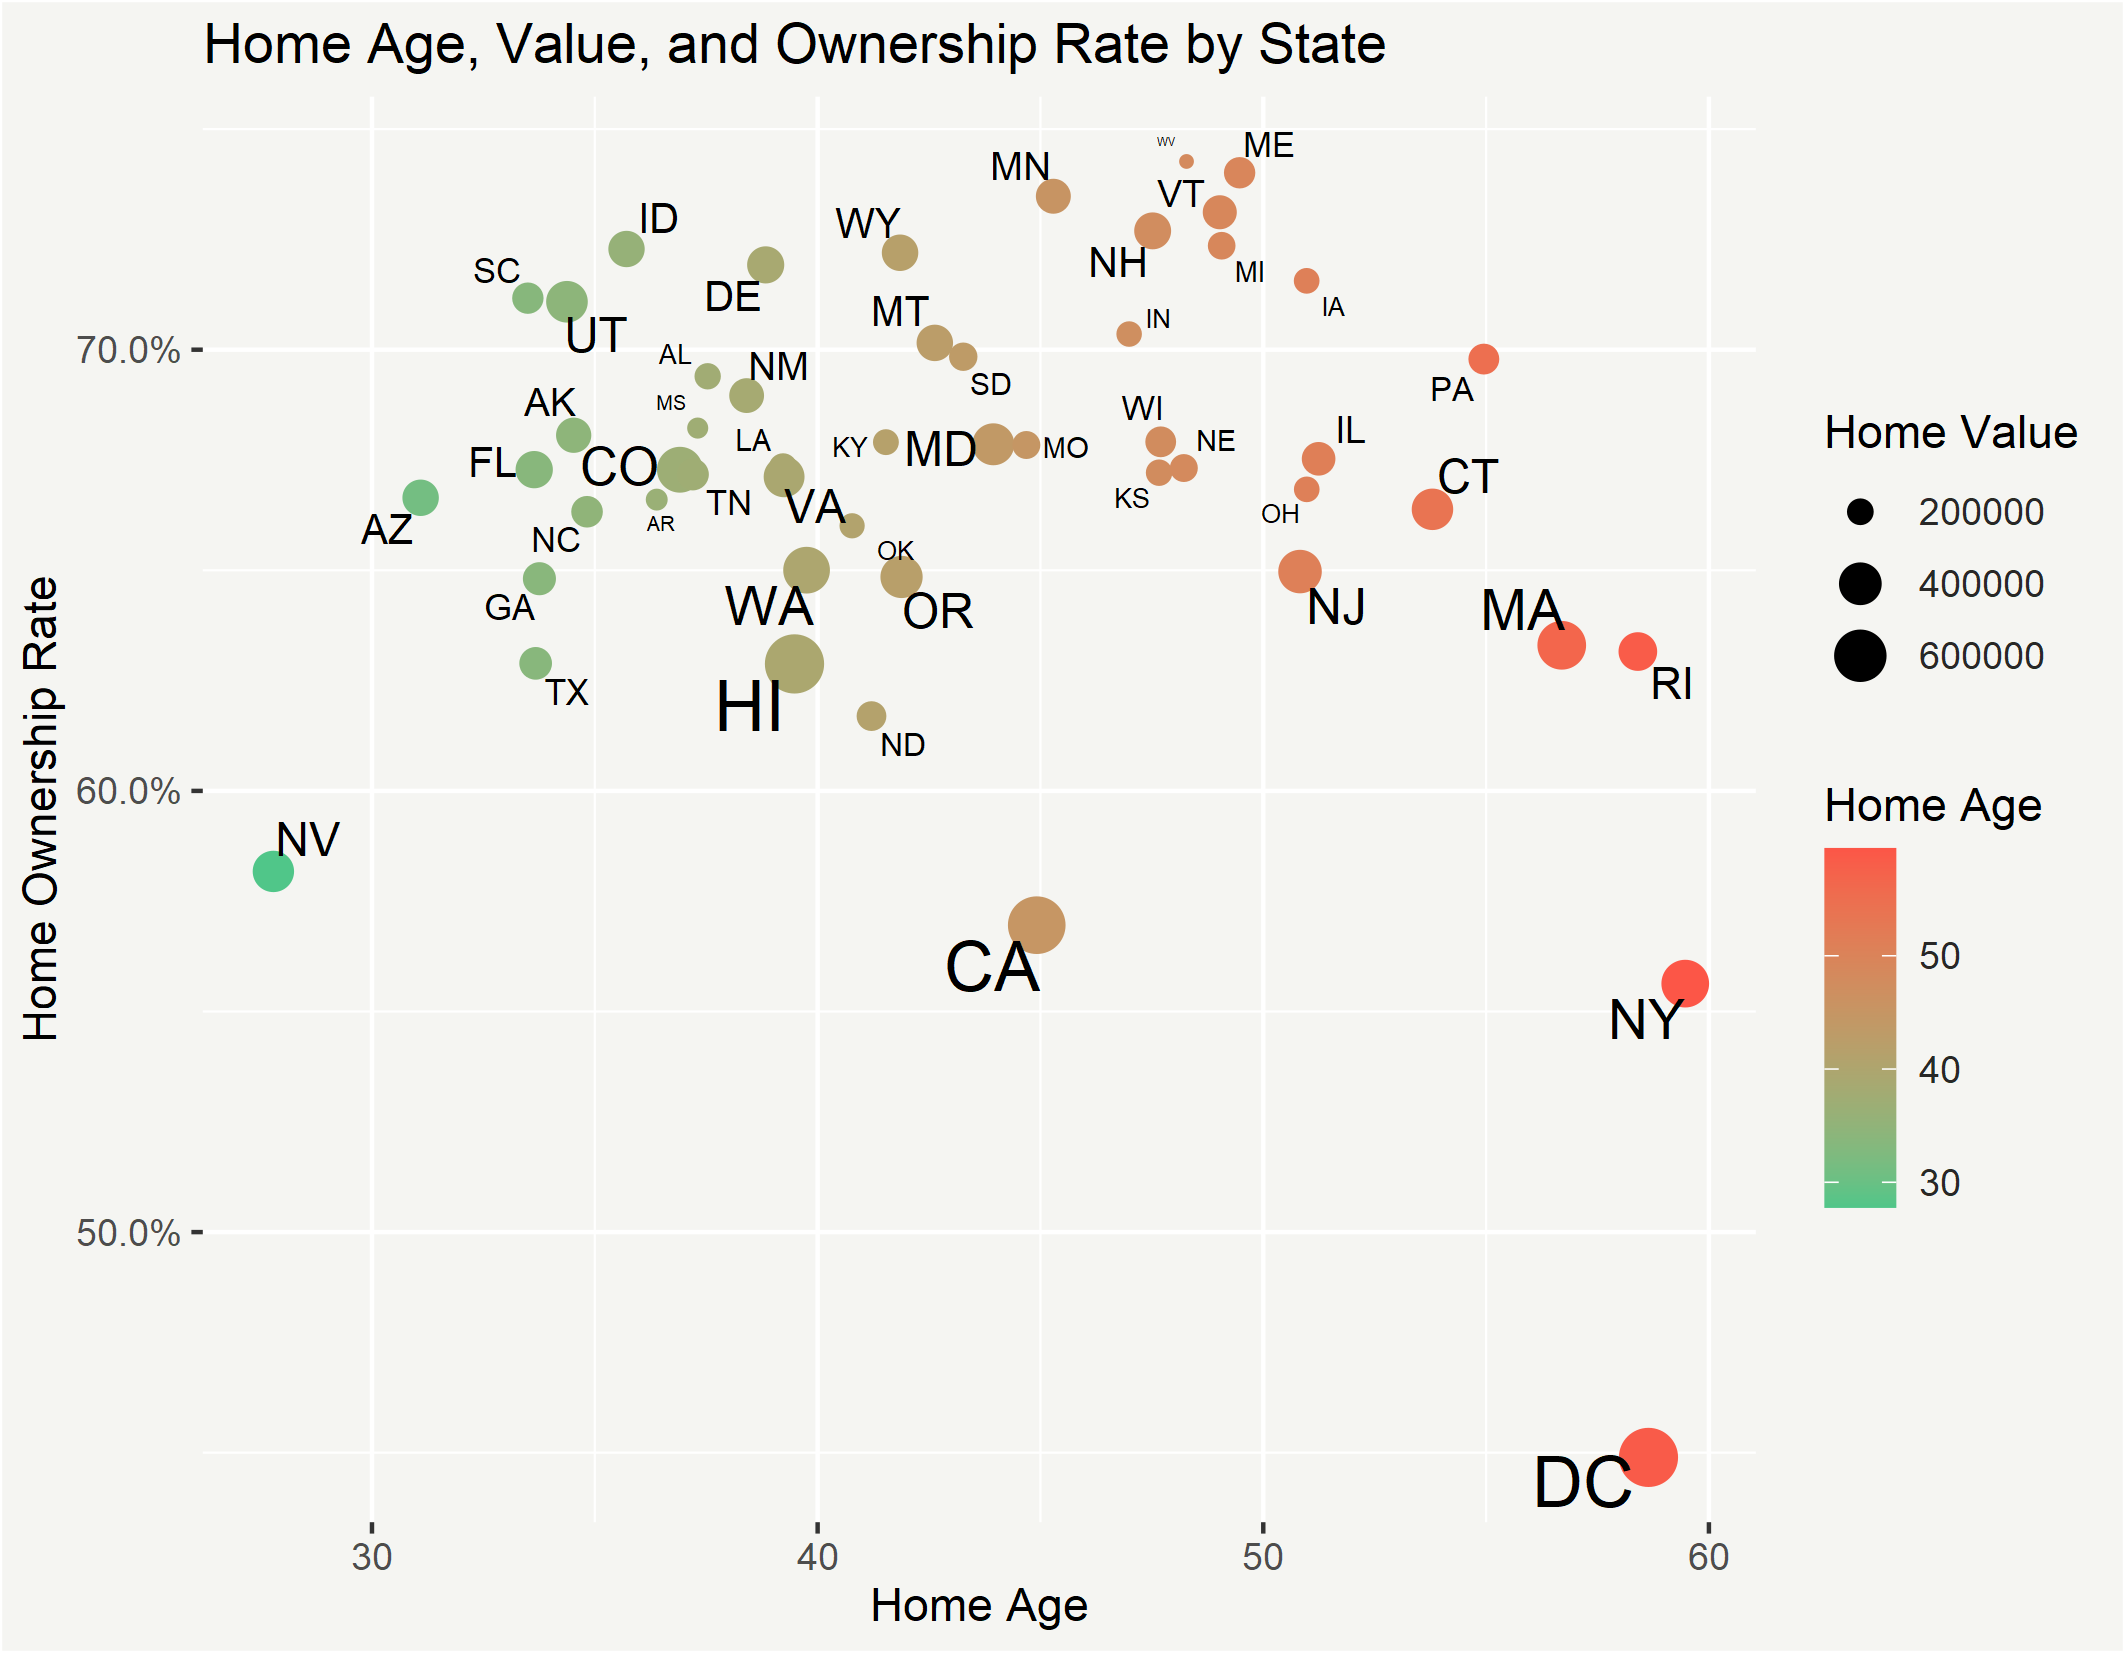
Home values are highest in Hawaii, Washington, D.C., California, Massachusetts and New York – areas marked by large concentrations of high-net-worth professionals or desirable climates – with average prices ranging from the $500,000 to $700,000. In contrast, the least expensive homes are found in Indiana, Oklahoma, Arkansas, Mississippi and West Virginia, with prices ranging from about $150,000 to $200,000.
Independent of other factors, home service spending will track closely with house prices, because both costs and wages rise roughly in proportion to home prices. This is particularly true for areas with higher percentages of homeowners. Homeownership is itself the last unique attribute of the housing stock that shapes home service spending. This is because it captures the intersection of physical attributes and demographic ones: the nature of how homes as an asset are owned.
Owners spend more than renters on their homes, and units occupied by their owners are the source of greater investment than those occupied by renters.
While the overall homeownership rate varies by the type of structure, single family homes sit right at the average, with about a 66% home ownership rate.
What is particularly unique about home ownership is that it does not necessarily correlate directly with high income areas. Washington, D.C., for example, is one of the highest income areas in the country but has a very low rate of home ownership. In contrast, West Virginia’s average income is relatively low, but it has one of the highest rates of home ownership. This contrast balances the otherwise conflicting tendency for spending to be higher in higher income areas.
This dynamic shows that it is not simply the nature of the underlying housing stock that shapes demand for home services. The other major component of demand for home services is equally important: the 331 million people living in the 128 million households that make up all of these structures.
1.2 The Role of Consumer Ages, Incomes, and Family Sizes
Just as the nature of the housing stock, how it is built, its age and its location shape the market for home services, so too do demographic attributes. Where we live, how old we are, the size of our families, our incomes and preferences, how our needs change year to year, and our family situations impact home spending, by shaping preferences, needs and fashions.
So, who buys home services?
Collectively, we all do. There are 331 million people in the United States living in 128.5 million households. But not all people spend the same, and not all households are composed of the same people. One of the most dramatic shapers of home spending, which is also constantly changing, is age.
Consumer ages can dramatically redefine both housing and home service needs.
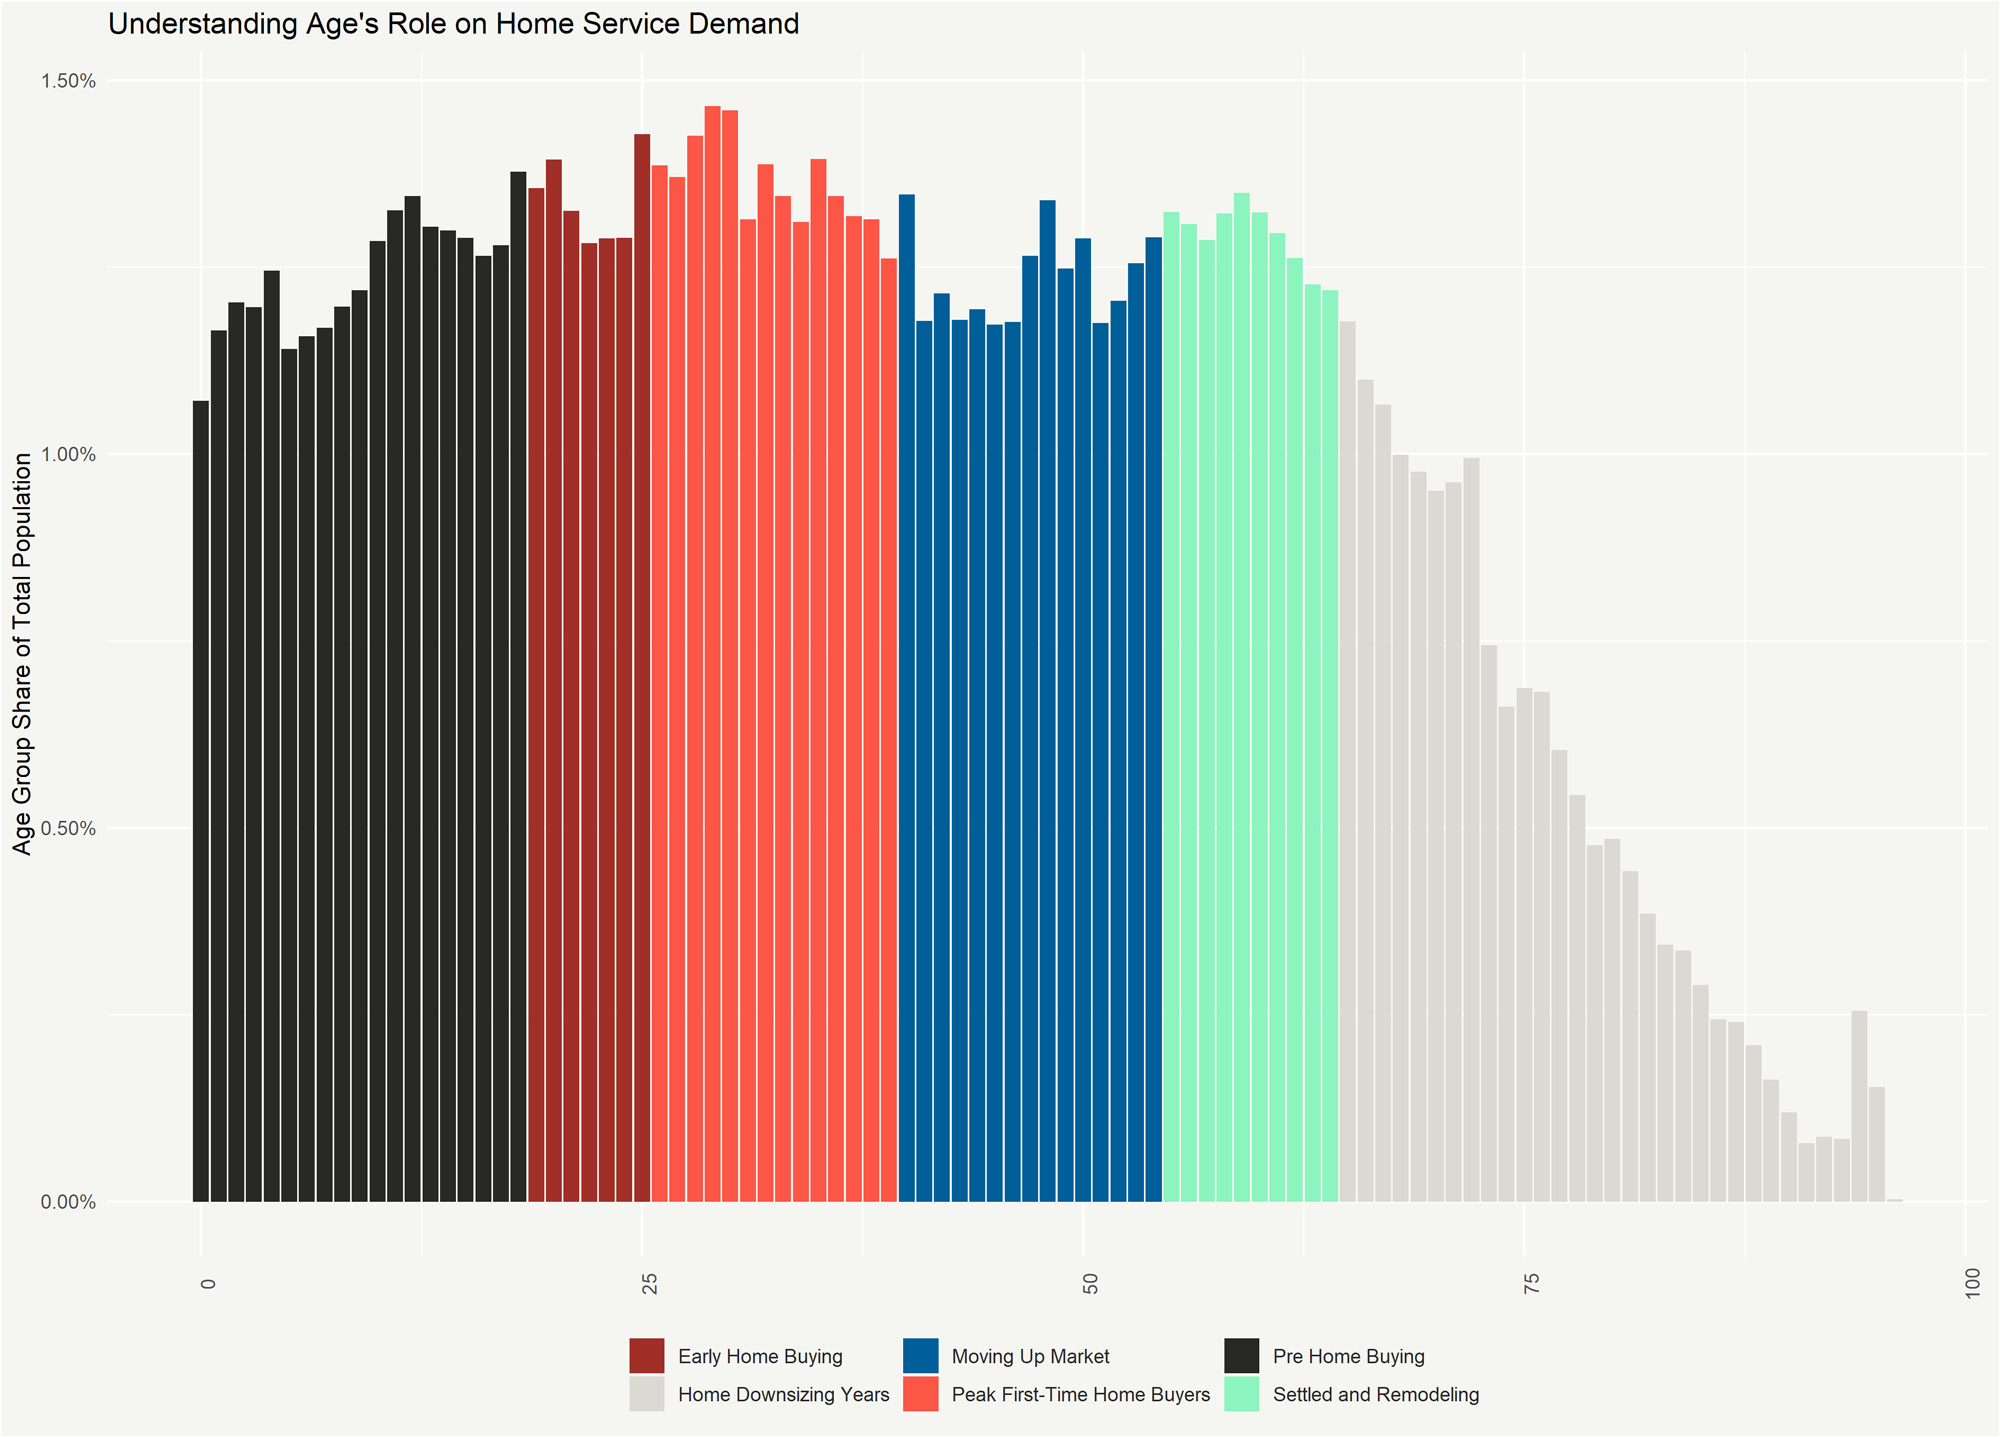
A college student or entry level young professional is less likely to own a home, have a family or have strong preferences about home choices. However, as people approach their late 20s and early 30s, home ownership rates rise. People start families and begin to have more specific home needs. This pattern carries on through many stages of life, each one marked with its own home needs and preferences.
What is currently unique about demographics and ages in the United States is the age of the two large cohorts known as the baby boomers and the millennials. The boomers are reaching a critical stage in life where they will need fewer homes with more requirements for renovations to age in place.
On the other hand, millennials are starting to hit peak home buying years (early 30s) and are beginning to renovate their homes to accommodate their growing families.
In this sense, the age composition of various states can shape home service spending in those states.
The youngest states of Utah, Texas, Alaska, North Dakota and Georgia, with average ages ranging from 33 to 38 years old, will have different home service demands than the oldest states of Maine, Vermont, Florida, West Virginia and New Hampshire, ranging from 41 to 43 years old.
While there is a relationship between the average age of residents and the number of individuals in their homes (e.g., roommates, spouses, kids and solo living tend to come at different stages), the relationship is not a direct one.
Different professional and cultural preferences can also shape household sizes and compositions which, in turn, can shape home needs, both directly and indirectly.
More people in a home means more needs, as well as more wear and tear, directly increasing spending. All else equal, two kids cause more wear and tear than one.
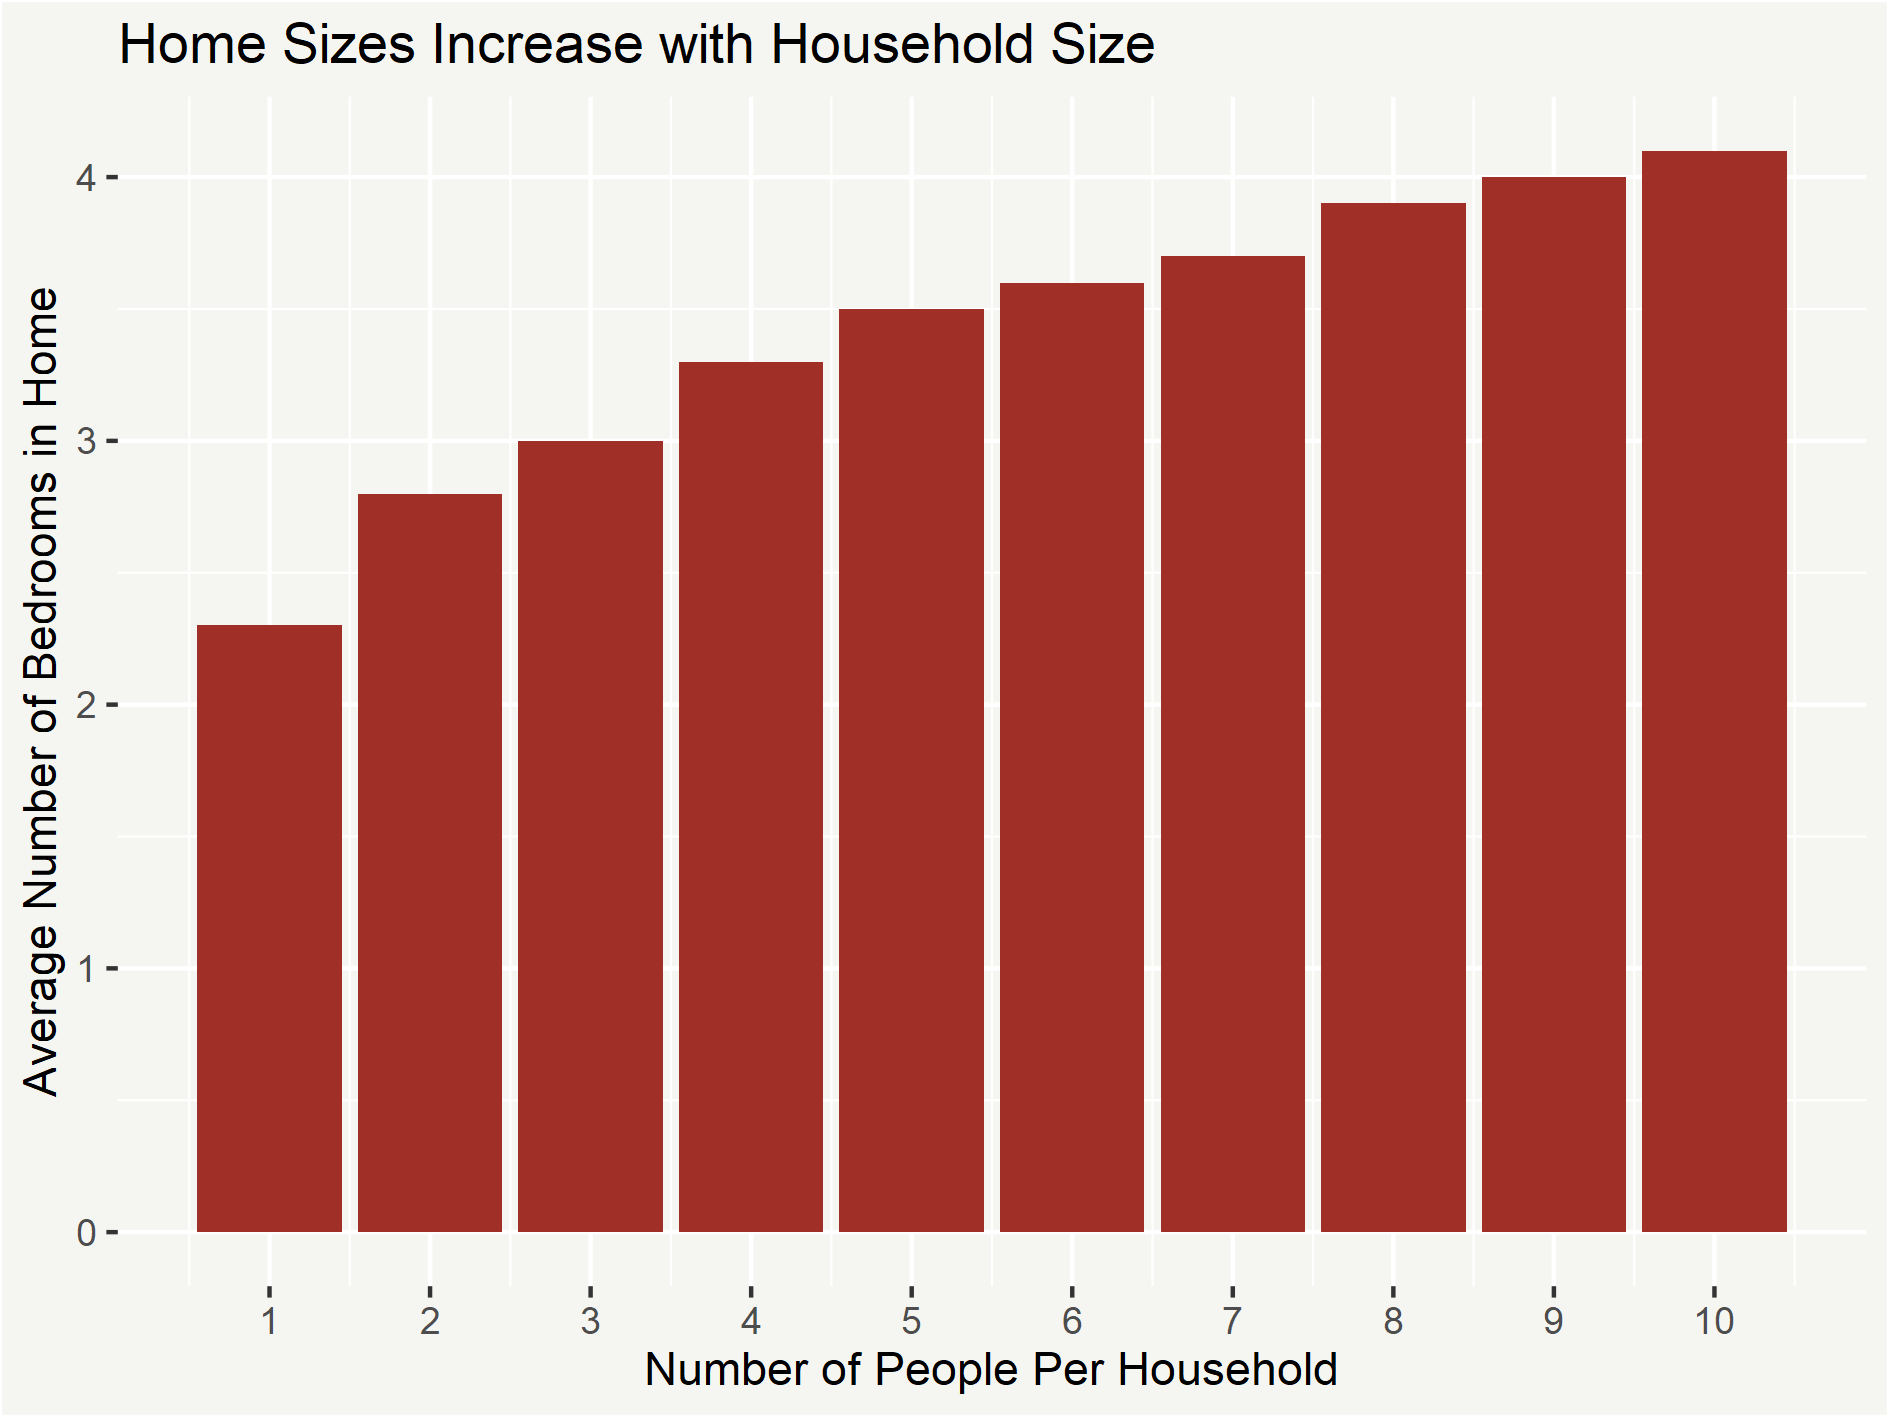
Larger households also tend to have larger homes, which also indirectly increases home spending. A family with two teenagers needs more space than a family with one, and two parents working from home require more space than one.
The largest household sizes are in Utah, California, Hawaii, Texas and New Jersey, where the average ranges from 2.3 to 2.7 people per household. In contrast, the smallest household sizes are characterized by states known for being common places for either retirees or young working professionals: Florida, West Virginia, DC, Vermont and Maine range from 1.7 to 2.0 people per household on average.
In turn, household size shapes home size and composition, with households of one person having an average of 2.3 bedrooms, rising in a linear fashion to 2.8, 3, 3.3, and 3.5 bedrooms as household size rises to 5 people.
But these core demographic fundamentals, such as age and household composition, are not the only shapers of home service demand.
Incomes are also a strong shaper of the home service market, and not only because higher income households can afford more forms of any type of spending, but also because higher incomes tend to cluster around certain locations and types of homes.
That’s why we can expect higher per capita home service spending in the wealthiest areas, such as DC, New Jersey, Massachusetts, Connecticut and California, where household incomes range from $112K to $133K, than in lower income areas, such as Louisiana, Alabama, Arkansas, West Virginia and Mississippi, where average household income ranges from ranging from $64K to $72K.
The demographics of households, homeowners and consumers are important shapers of how money is spent on home services, but there is another large demographic component that shapes the home service market: the skilled tradespeople doing the work.
1.3 The Number of Skilled Tradespeople Working in Home Services
There is no formally defined category of skilled tradespeople who work exclusively in home services, so estimates will vary.
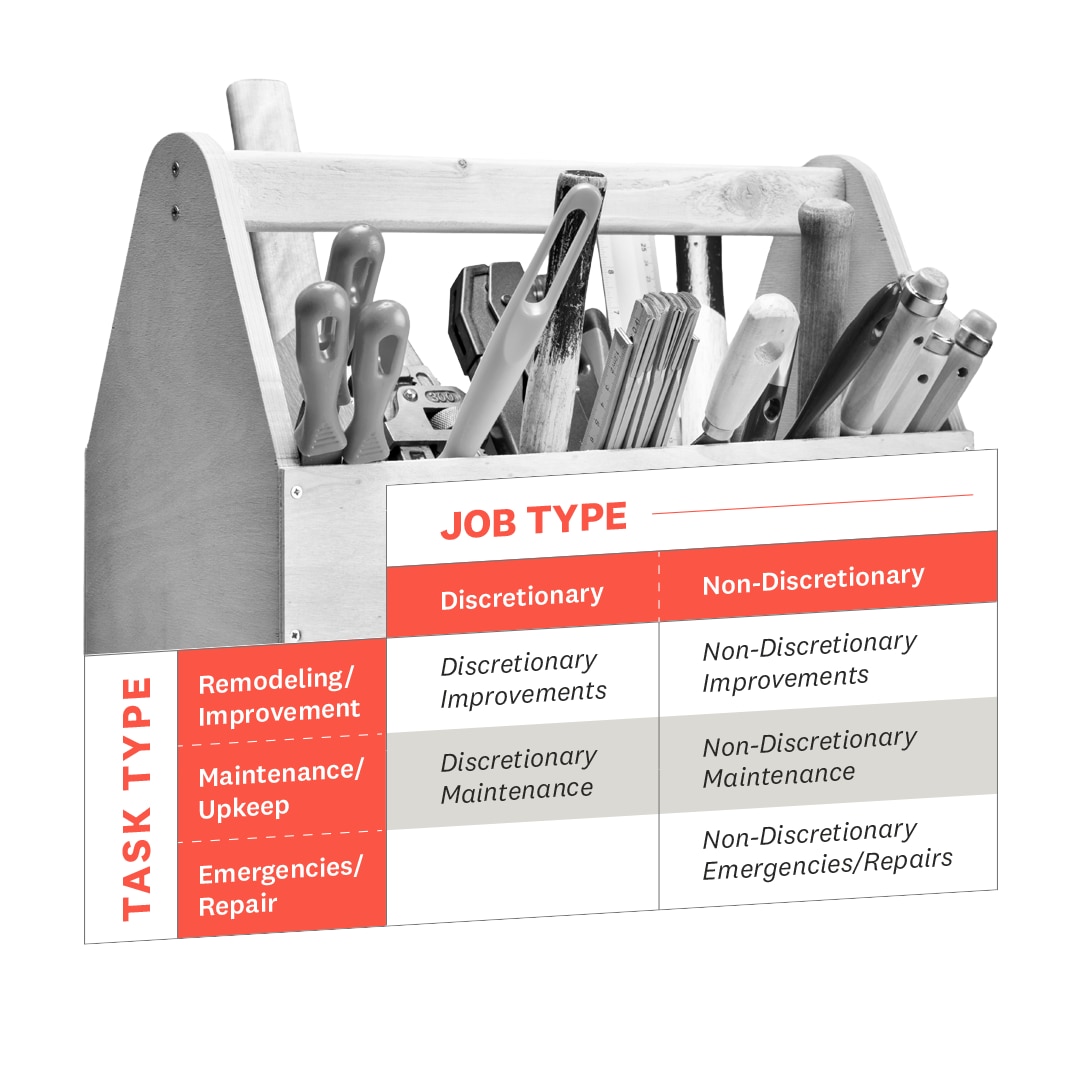
Our estimate relies on the formal definitions for certain common occupations found in home services: Carpenters, Electricians, Plumbers, Maids and Housekeeping Cleaners, Landscape Architects, Appliance Repairers, etc. While these occupational categories are a good start, the records of which industries these tradespeople work do not track how closely they work on the services for existing homes, new home construction, or commercial or industrial facilities. It is also not out of the question for a skilled tradesperson to potentially work on some mix of residential, commercial, industrial and new construction properties in any given year.
The matrix below captures the six primary areas of potential work for a skilled tradesperson, with the largest category of the home service market – existing residential structures – captured in green.
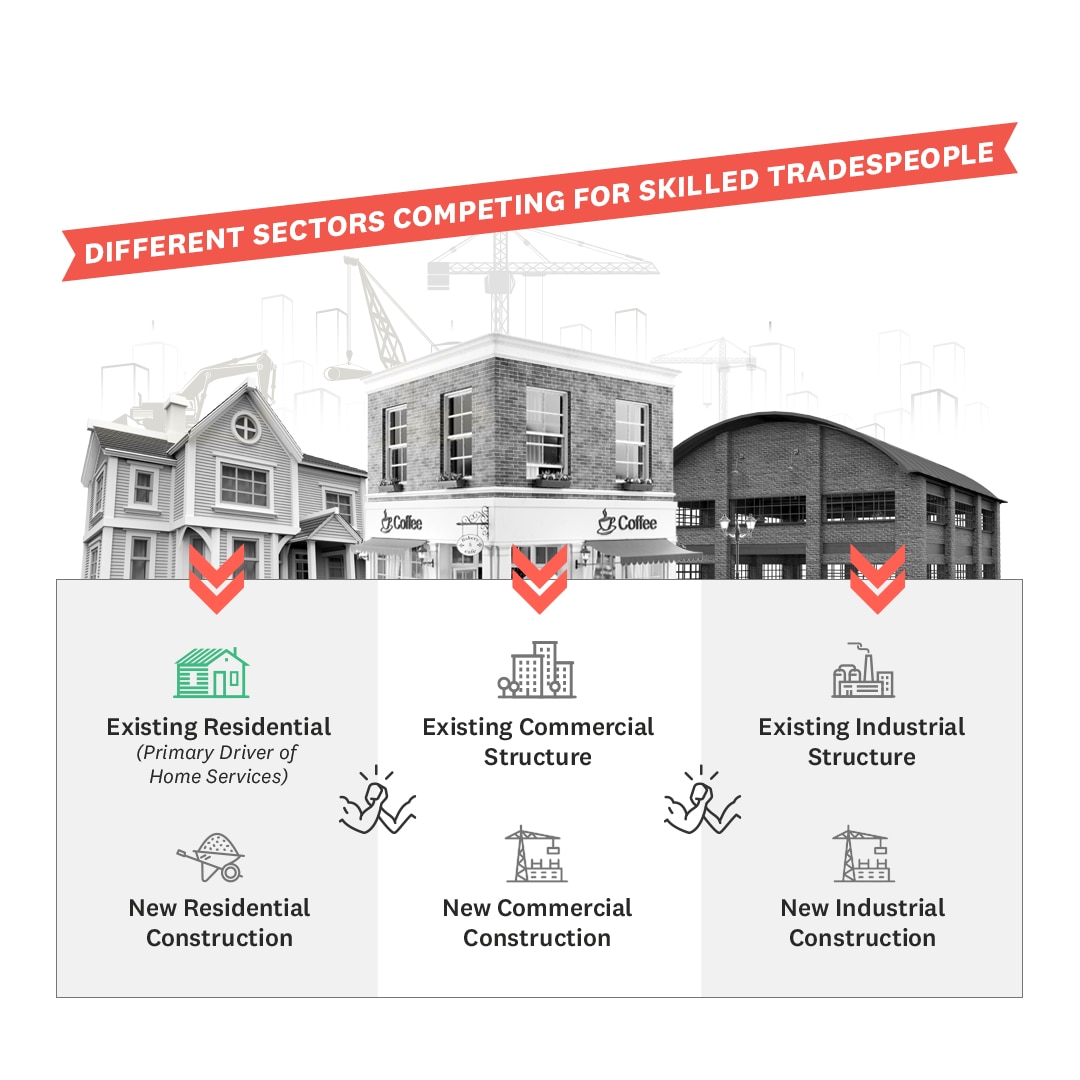
An additional challenge: each of these six different areas of work are not necessarily captured in a single industrial classification.
For example, there are nearly two million maids and house cleaners in the country; however, in calculating an estimate for home services one would likely want to remove the 469,600 that work in the traveler accommodation industry but include some percentage of the 545,800 that work in services to buildings and most of the 356,700 that work in private households.
Our methodology affords at least an approximate estimate of how many people are working in home services by focusing on which sectors likely have the most overlap.
Taking all of this into consideration, we estimate the total number of professionals working in home services at approximately 5.8 million.

This is different than the number of total home services business, which will fluctuate over time as tradespeople transition from working solely for themselves, to working for other employers, to hiring their own employees. However, our survey data suggests that 36% of tradespeople in home services work solely for themselves, and the remainder work for companies with an average size of 6.4 people. This would suggest there are approximately 2.7 million home service businesses currently operating. As macroeconomic conditions change, and the percent working as sole proprietors shrinks or grows, and the average size of a company expands or contracts, this could conceivably dip to as low as 2 million businesses or as high as 4 million businesses.
By cross tabulating individual occupational skills, narrowing the down to just the industries that capture some degree of home service spending, and then weighting their share based on the nature of the underlying industry they’re identified as working in, our estimate of total tradespeople identifies this group of occupational and industry categories that supply the labor for the home service market.
This is a sizable labor force—roughly the population of Colorado or Wisconsin—that services our 141M housing units. It is also a sizable source of earnings for millions of families. If incomes average around $40,000 to $50,000 per worker, that would add up to approximately $232B to $290B in earnings —around the total value of Chile’s economy.
With a full understanding of the demographics, housing units and professionals that shape our market, the foundation is set to fully understand our home services market.
Part 2: The Market for Home Services
The home services market is a function of demographics, the housing stock and the tradespeople available to do the work. With a foundational understanding of those established, we can now look at how large the market is entering 2021 following the substantial impacts of 2020.
2.1 How Big is the Market for Home Services?
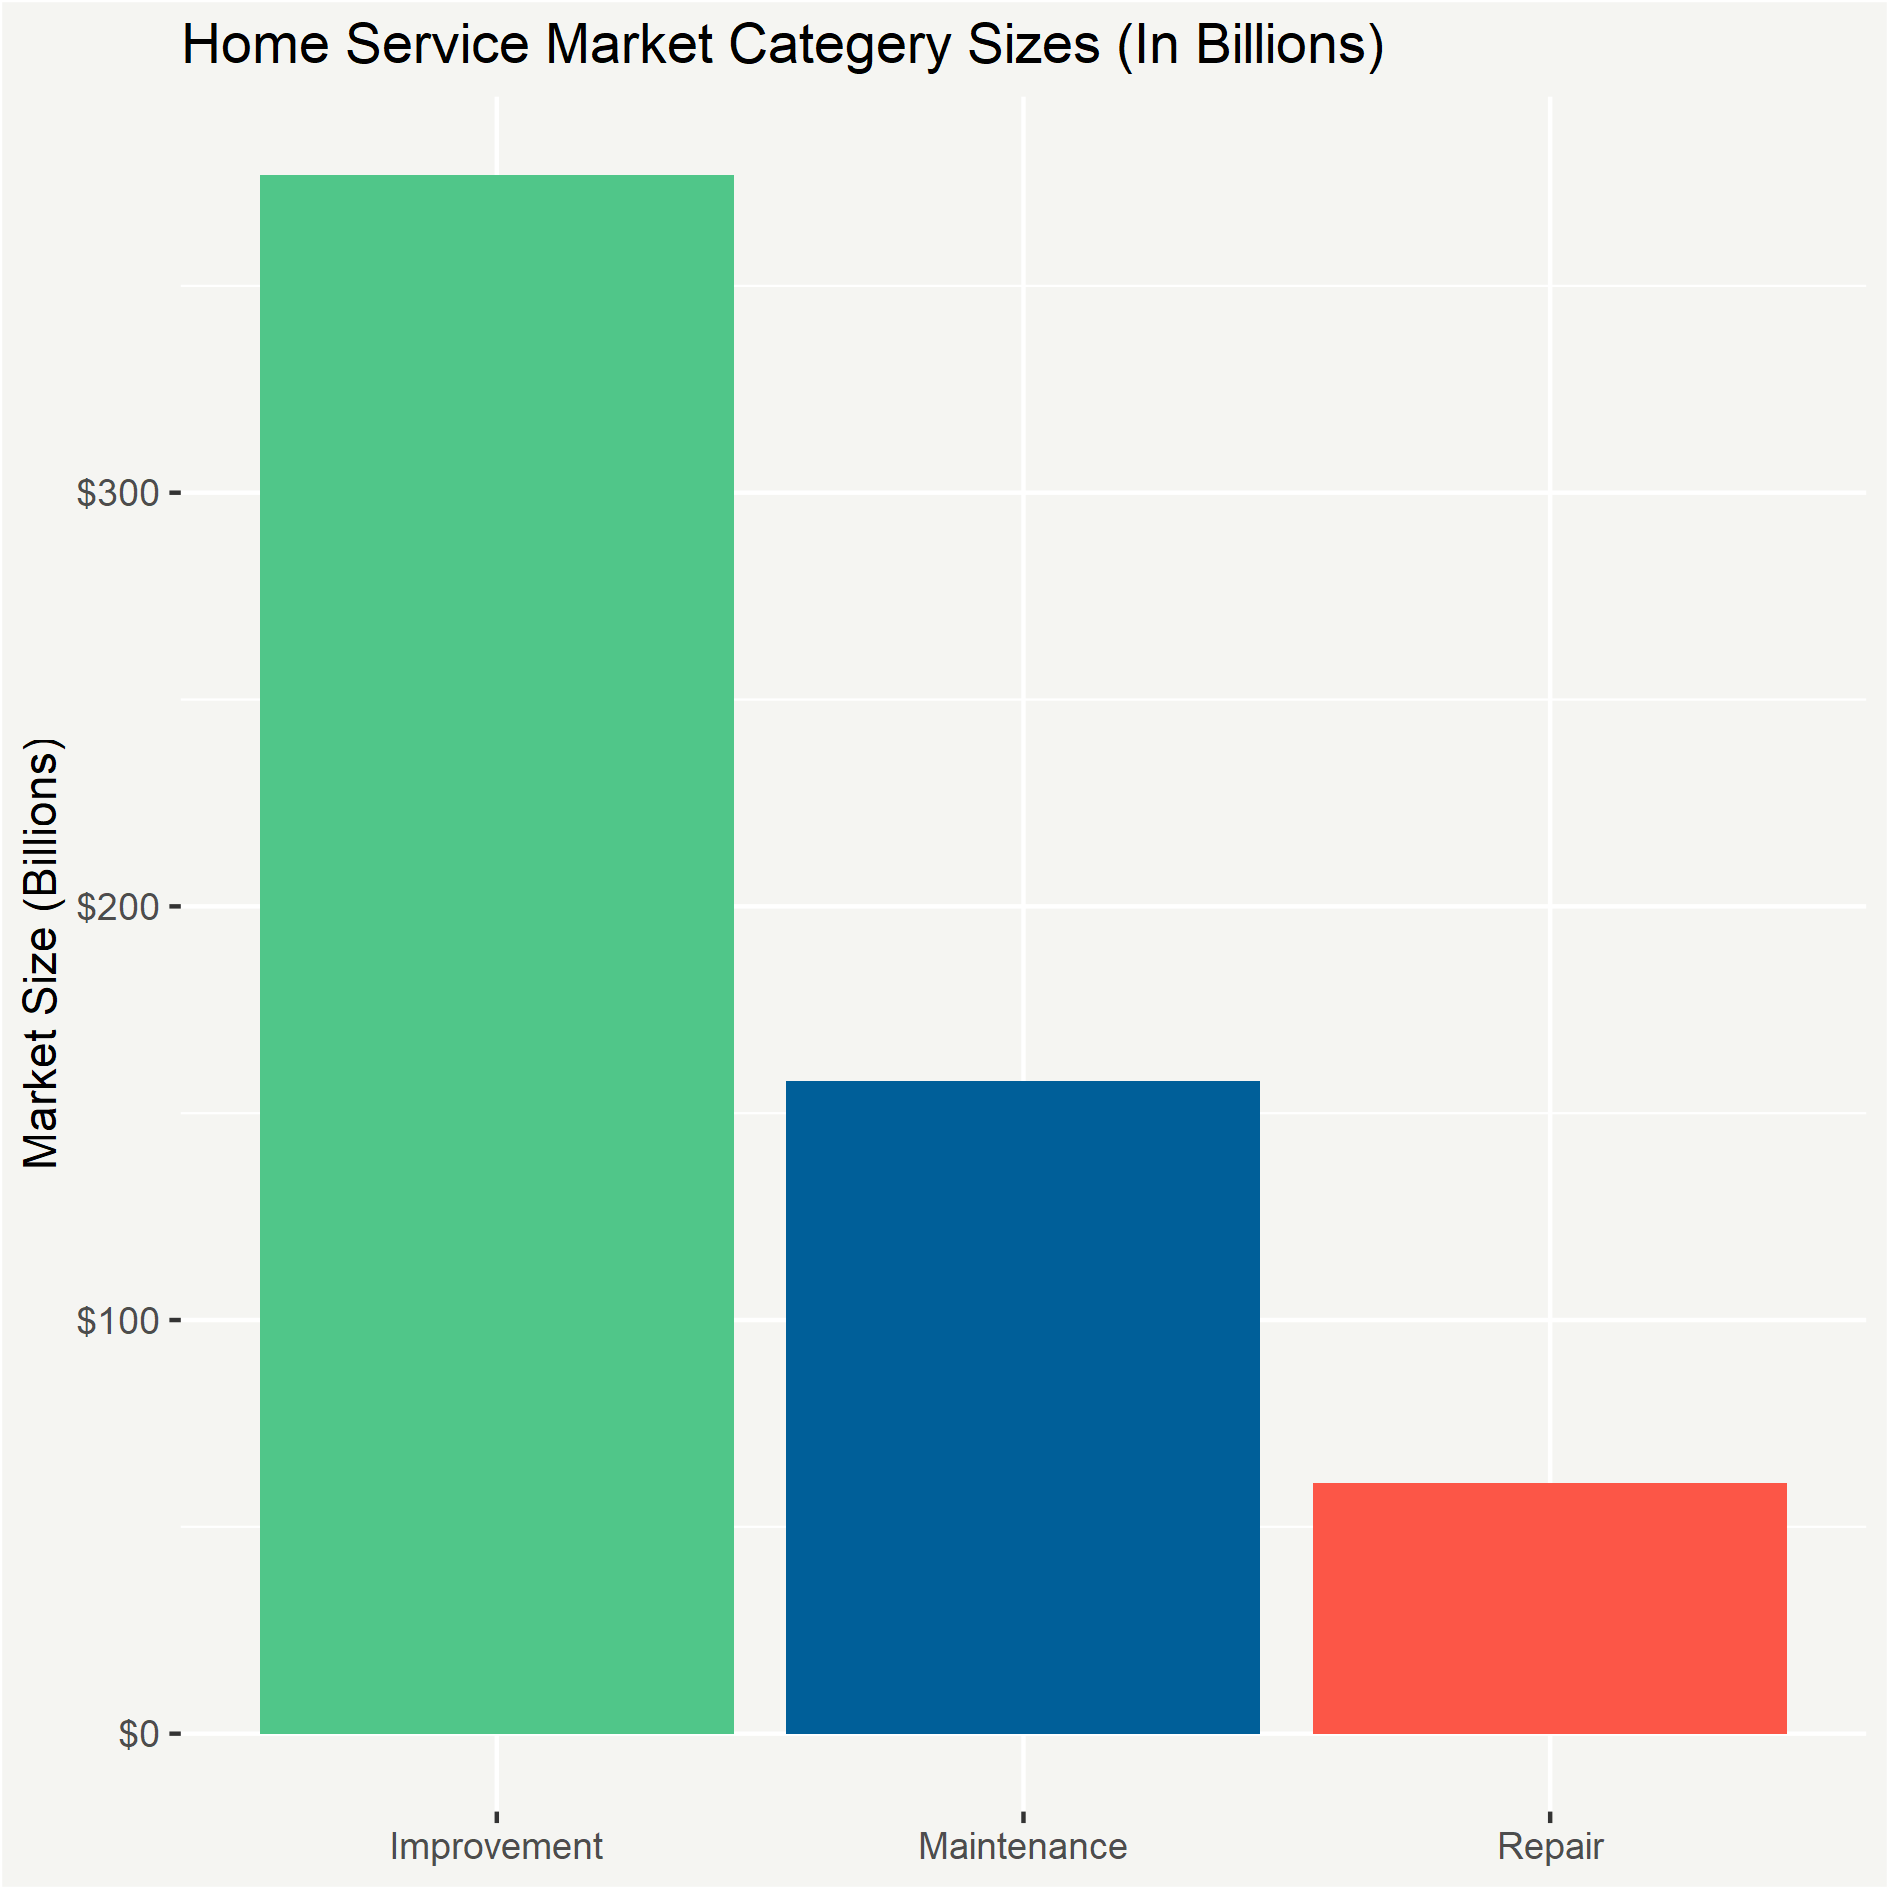
Entering 2021, the total addressable market (TAM) for home services is $595B.
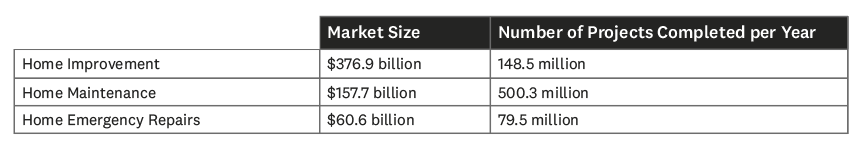
This estimate is further broken down across each of the three main categories:
- Home Improvement Spending at $376.9B
- Home Maintenance Spending at $157.7B
- Home Emergency Spending at $60.6B
The addressable market figure reflects total consumer expenditures on hired-out home improvement, home maintenance and home emergency repairs. It does not capture DIY activity but does include all spending on parts and materials.
A TAM of $595B represents a 17% increase above our 2020 estimate of total home spending. While the number is large—$595B is larger than the economies of Thailand or Belgium, and nearly as large as the $625B economy of Sweden—it is only about 1.8% of the $33.6 trillion value of all residential real estate. More specifically the total market spending as a percent of overall home values are a modest 1.1%, 0.5%, and 0.2% per year for improvement, maintenance, and emergency repair, respectively. Additionally, the $89B increase from 2020 to 2021 is only about 3.5% of the $2.5 trillion home equity gained in 2020.2
The 17% increase could be a result of a multitude of factors: higher average consumer spending, more consumers entering the market, higher prices for labor, higher prices for materials or, as is commonly the case, some combination of all the above. However, one component deserves particular attention: the price of materials.
The prices of certain types of lumber common to remodeling projects have skyrocketed—in some cases 200-300%.3 The varying nature of remodeling projects makes it difficult to estimate how much of the market increase is due to higher material costs; however, estimates suggest the rise in materials prices is increasing the cost of new homes by roughly 10%, so it is possible that as much as 1/3 to ½ of the increase in total addressable market (TAM) is due to price increases. It follows then that the overall TAM growth reflects some temporary rise due to artificially higher prices. However, it is unlikely that the 2021 TAM will shrink by much, if at all, going forward. Overall price inflation will serve as a floor on price reductions, and industry specific issues such as low lumber prices following the housing construction bust during the great recession were probably temporary. The demand side boom as a result of Covid-19 could itself be temporary, but newfound household wealth due to unexpected home equity gains, as well as demographics tailwinds, will similarly serve as a floor on demand reduction. In other words, the growth in the overall size of the market does not mean that consumers are intentionally spending 20% more. Market size growth could also be a function of increased lumber costs and other inputs. This cost of supply is driving up total spending on fixtures, hardware, appliances and chemicals, which are all involved in the home service good supply chain.
One important note: we have revised our estimation methodology and data from 2020 to 2021 so, while the overall market is larger, direct comparisons between the improvement, maintenance and emergency repairs markets would not be appropriate between the years.
In addition to breaking out the total size of the market, our novel approach allows us a detailed look at different angles within the market, such as a state-by-state basis or by type of living structure.4
The largest amount of home spending takes place in California, Texas, Florida, New York and Pennsylvania, with spending peaking ranging from $21.8B in Pennsylvania to $81.4B in California. The areas with the lowest spending are DC, North Dakota, Arkansas, Wyoming and Vermont.
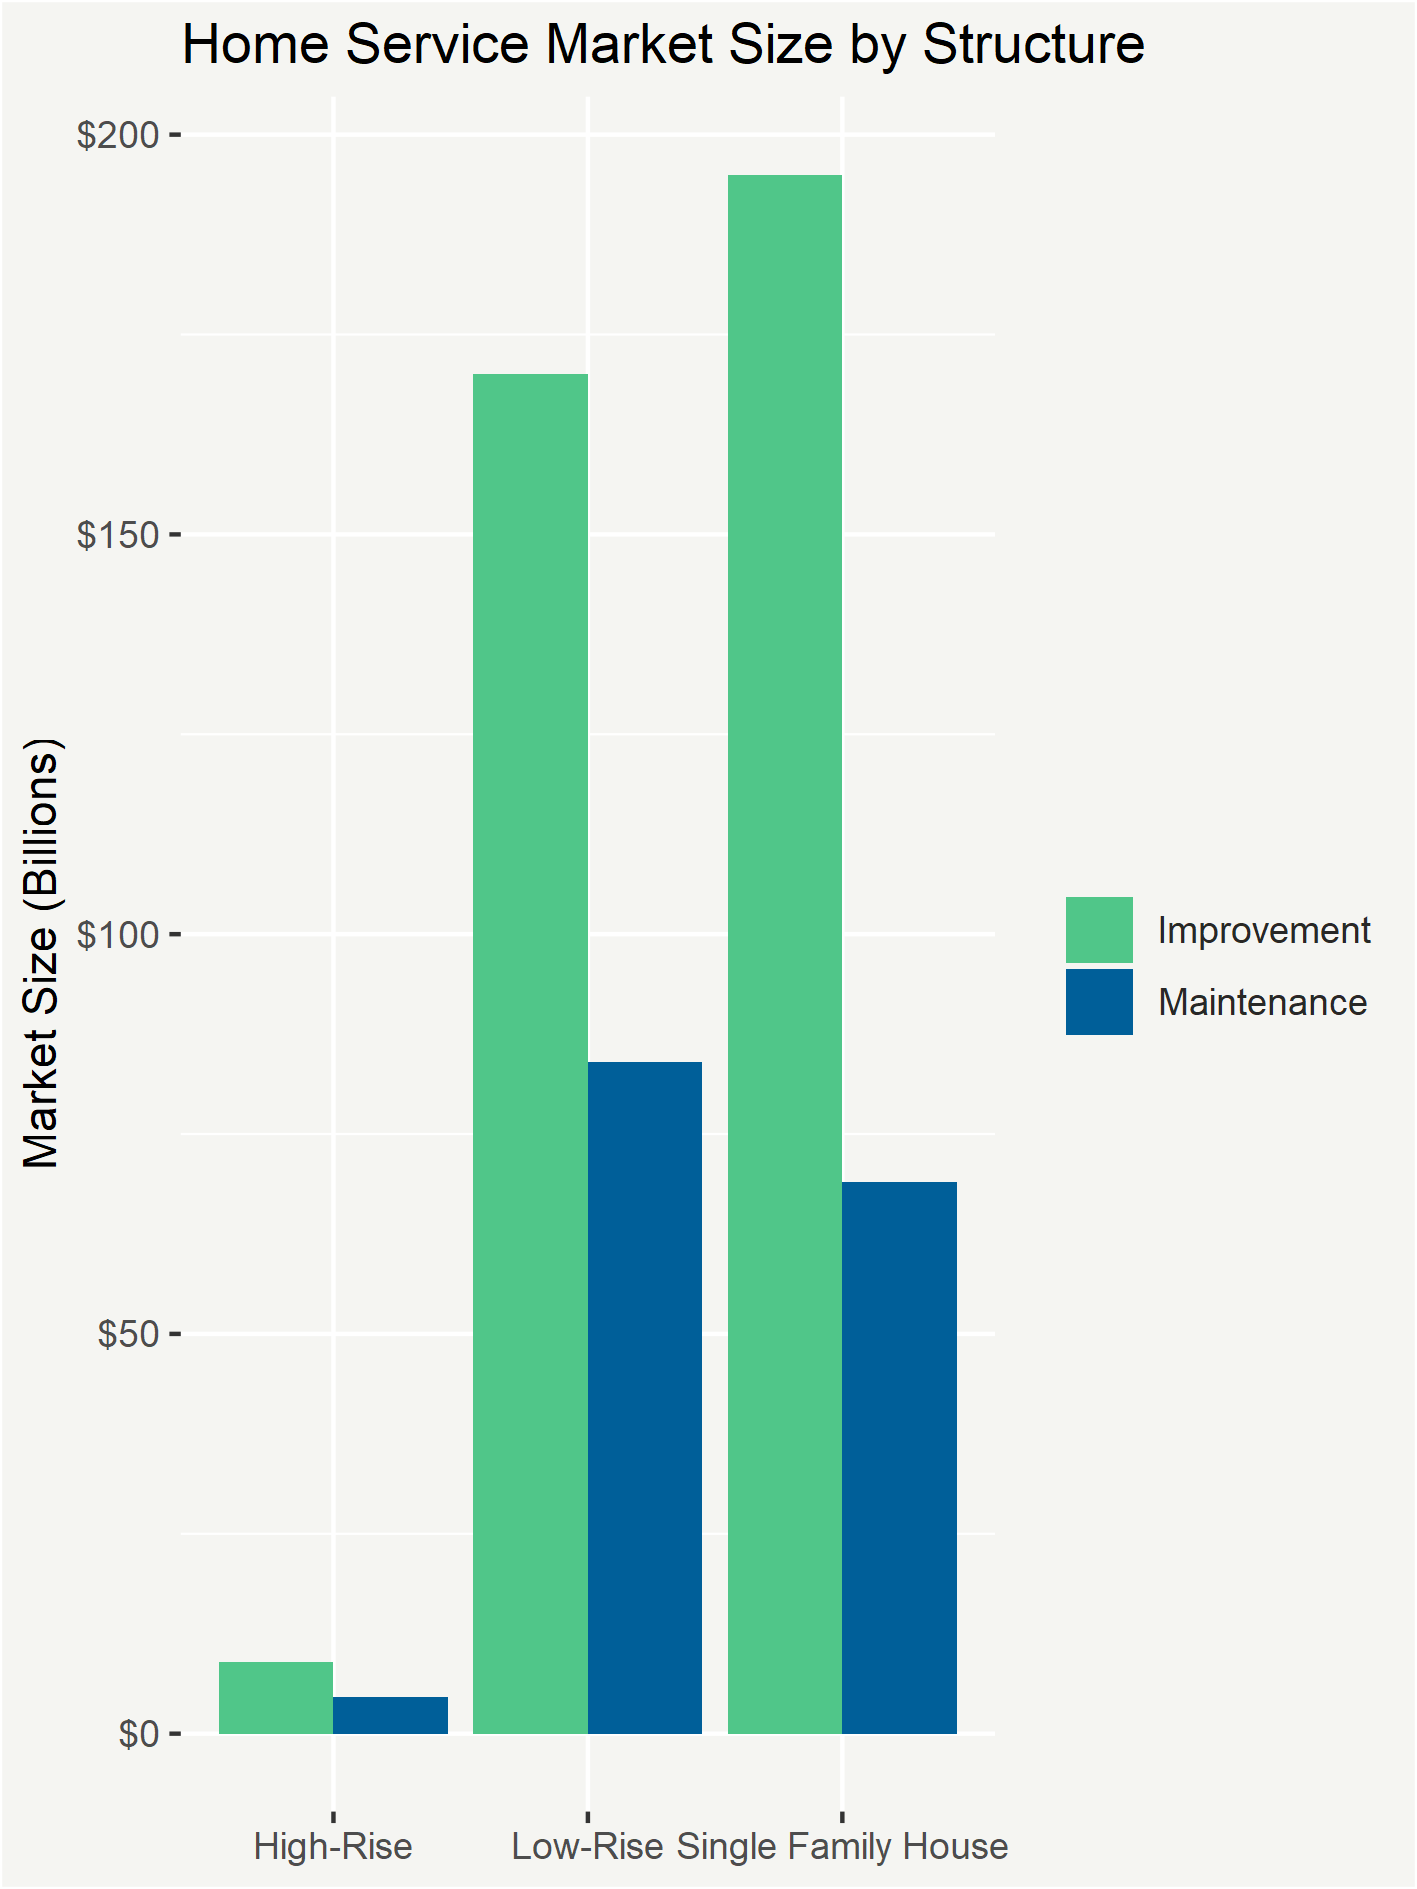
The varying nature of the housing stock outlined in Section 1 becomes evidently clear as we examine the market size and total spending by structure.
The intersecting nature of the types of homes built in certain areas (cost), at certain points of time (age), and for certain types of households (size, renters), come together in the market sizes for these types of housing.
While single family houses outnumber townhouses/duplexes/triplexes/fourplexes 3:1, the latter tend to exist in higher cost areas so their overall improvement spending is well above 3:1. Furthermore, because they tend to be newer, owners of townhouses/duplexes/triplexes/fourplexes are more likely to spend on maintenance vs. remodeling. They are less likely to have storage space for common maintenance tools, so the maintenance market is actually larger than might otherwise be expected.
Ultimately, topline spending is only half of the equation of the market, with the number of projects taking place as a second, critical piece of the market. The number of projects tells us about the propensity to spend more or less on any given project, as well as the tendency for households to hire out regular recurring services such as landscaping and cleaning.
2.2 How Many Tasks Are Completed?
There are 728 million tasks completed across the $595 billion in total home service spending. This averages out to 5.2 tasks per housing unit.
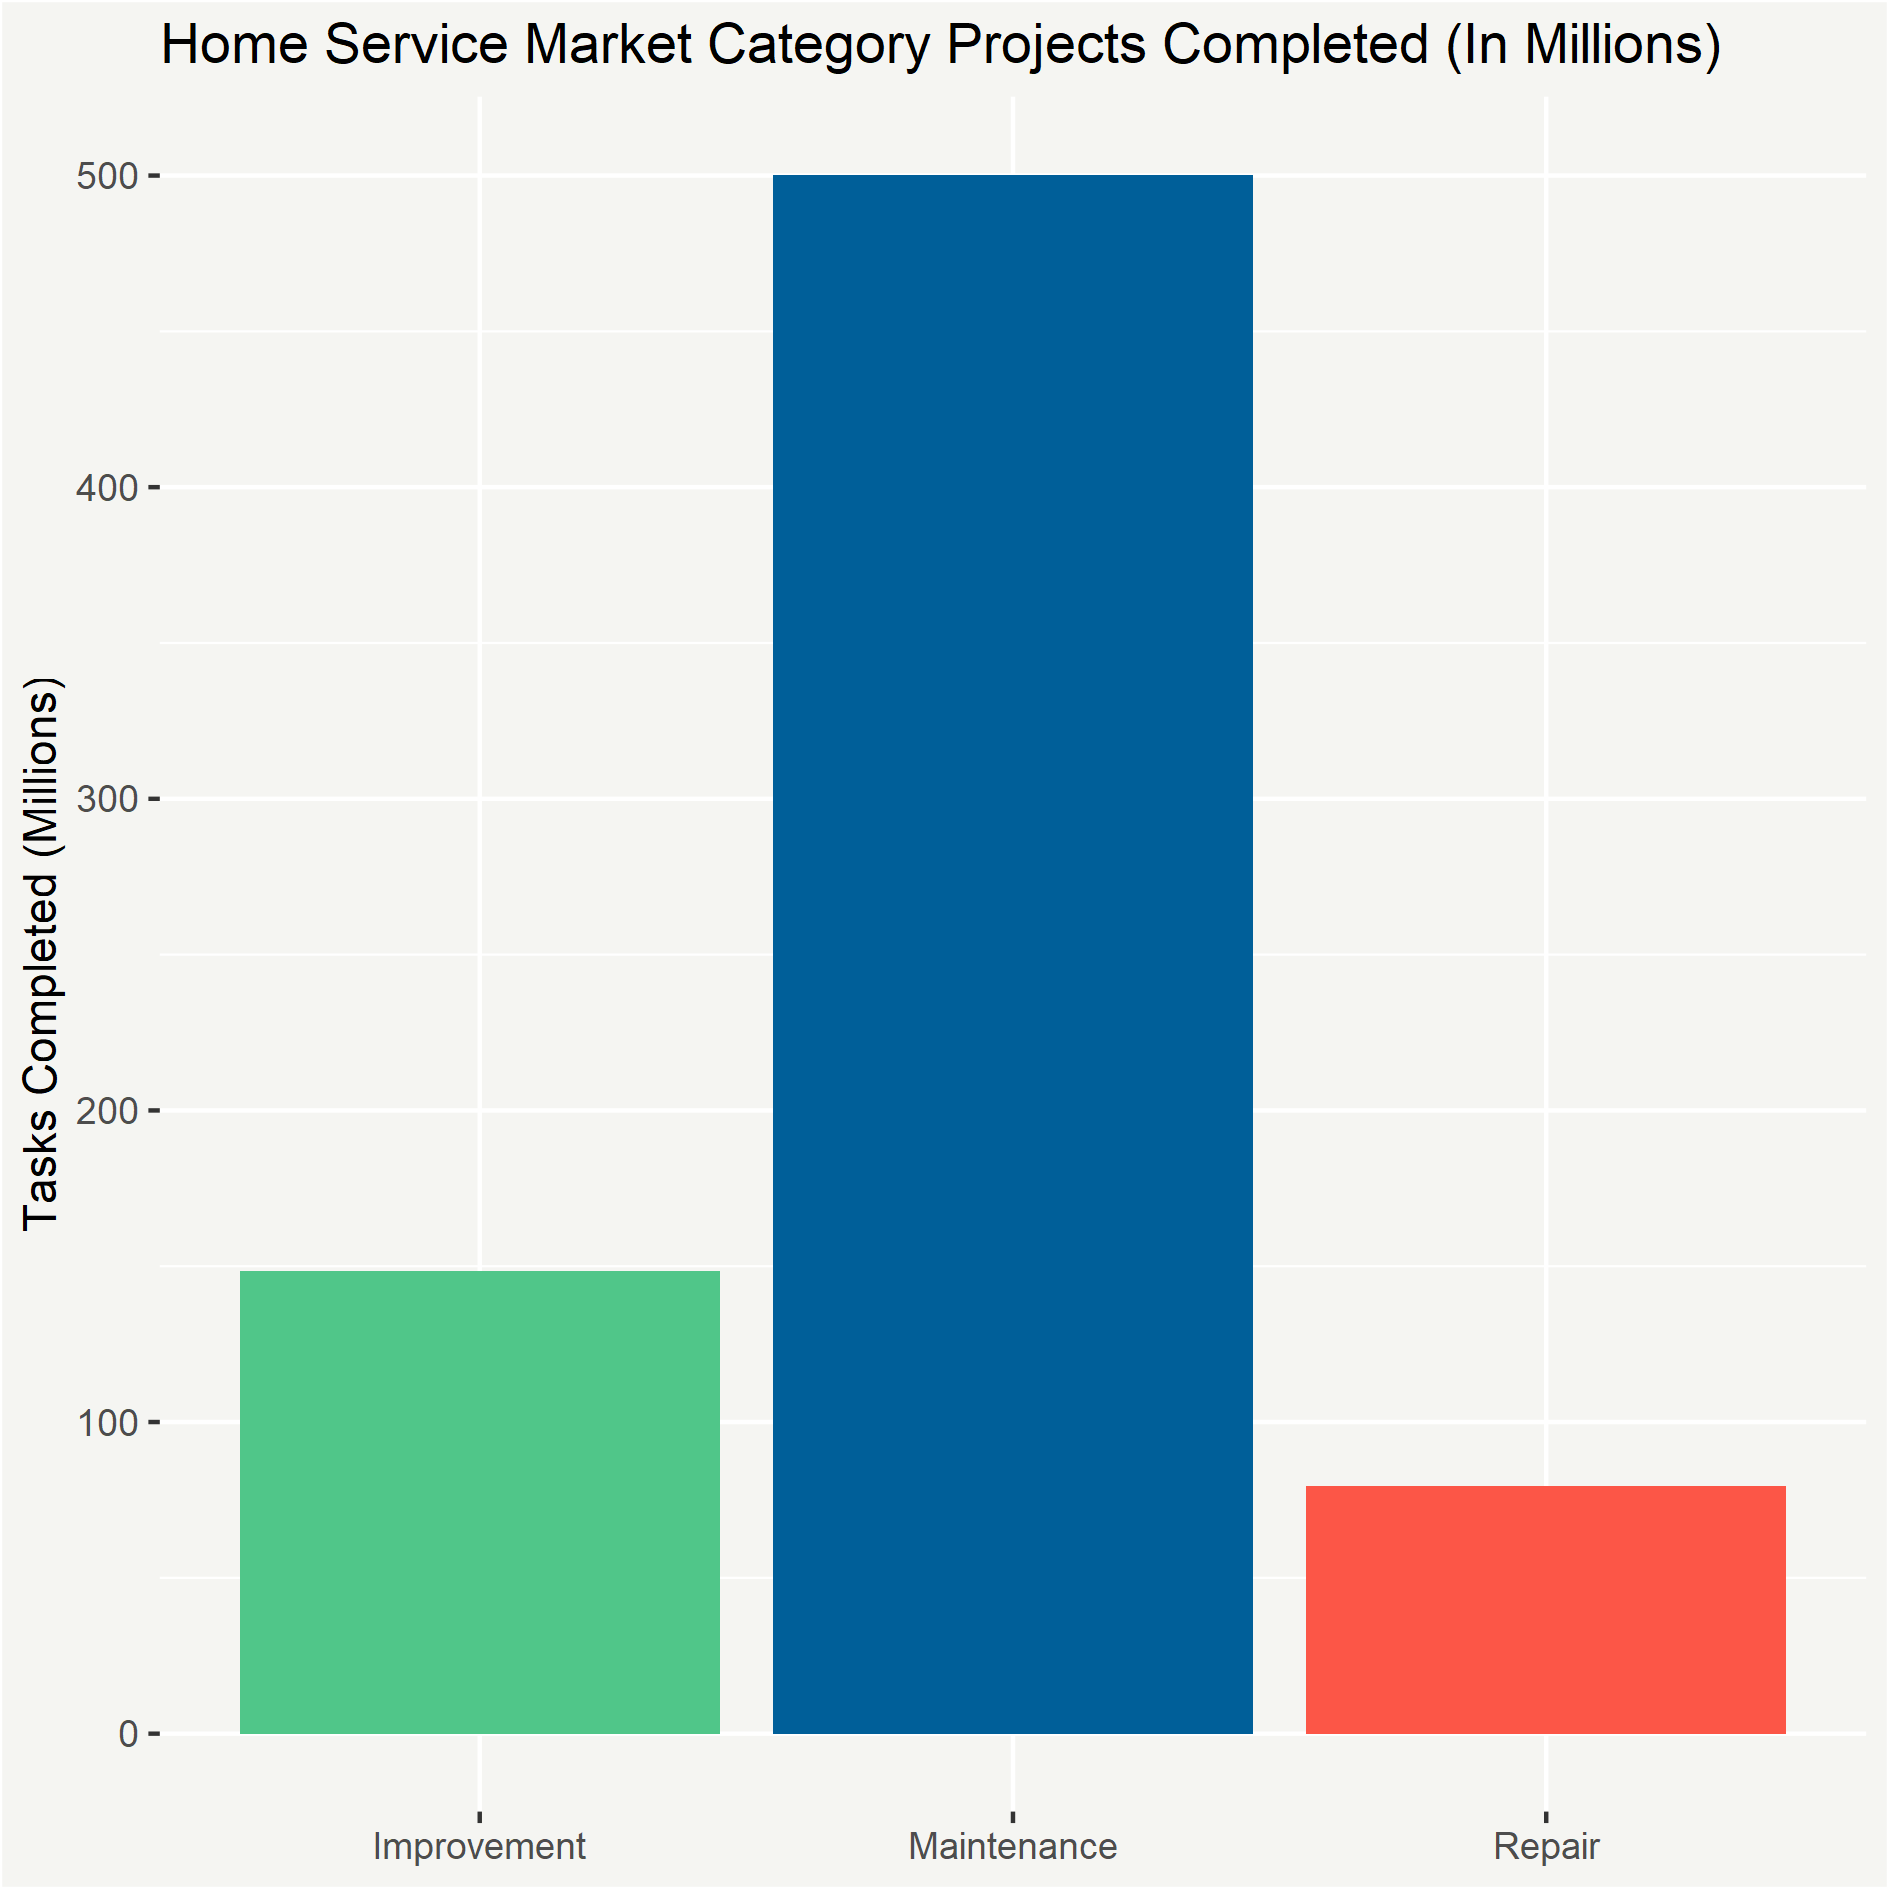
Individually, we also estimate the total number of projects completed across each of the three main home service categories. Our 2021 estimates for these categories are:
- Number of Improvement Projects: 148.5 million
- Number of Maintenance Projects: 500.3 million
- Number of Emergency Repair Projects: 79.5 million
While a total of 728M tasks seems large initially, it is considerably smaller than it could be.
The individual figures are different from prior year’s because our updated methodology includes estimates for commonly underestimated maintenance tasks. These tasks, such as landscaping and housecleaning, are likely undercounted due to their nature as repeated or recurring services.
Take house cleaning for example, which many families might agree could happen once a week if time and money afforded it. In that case, just the number of cleanings for individual housing units would be 7.3 billion per year—more than 10 times the total number of projects currently being completed across all home service categories.
For landscaping, assuming a conservative scenario of six visits per year (perhaps once a month upkeep during the summer months), the total could be 540M just for single family houses.
For home improvement, the number of projects works out to an average of just over one single project per house. For maintenance independent of the reoccurring tasks like cleaning and landscaping, it works out to even less.
As with the total market spending estimates, our estimation methodologies have been updated since the 2020 report, so one should not make direct comparisons of the number of annual tasks being completed in each category in 2020 vs. 2021. In addition to better capturing undercounted recurring maintenance tasks, this year’s estimate made improvements in more clearly defining the differences between improvement, maintenance and emergency repair spending.
Knowing the large size of the market and the critical role it plays in bettering our lives, it is also important to make some distinctions between the home services market and the housing market.
2.3 The Home Service Market is Not the Housing Market
While the two likely share a labor force with similar skillsets, the market for home services is not the same as the new home construction market.
Home services is focused heavily on maintaining, improving and repairing the 141M existing housing units across the country. The housing market is predominantly characterized by either the buying and selling of existing homes—which produces large toplines in economic activity, primarily in the form of debt changing hands—or the construction and sale of new homes.
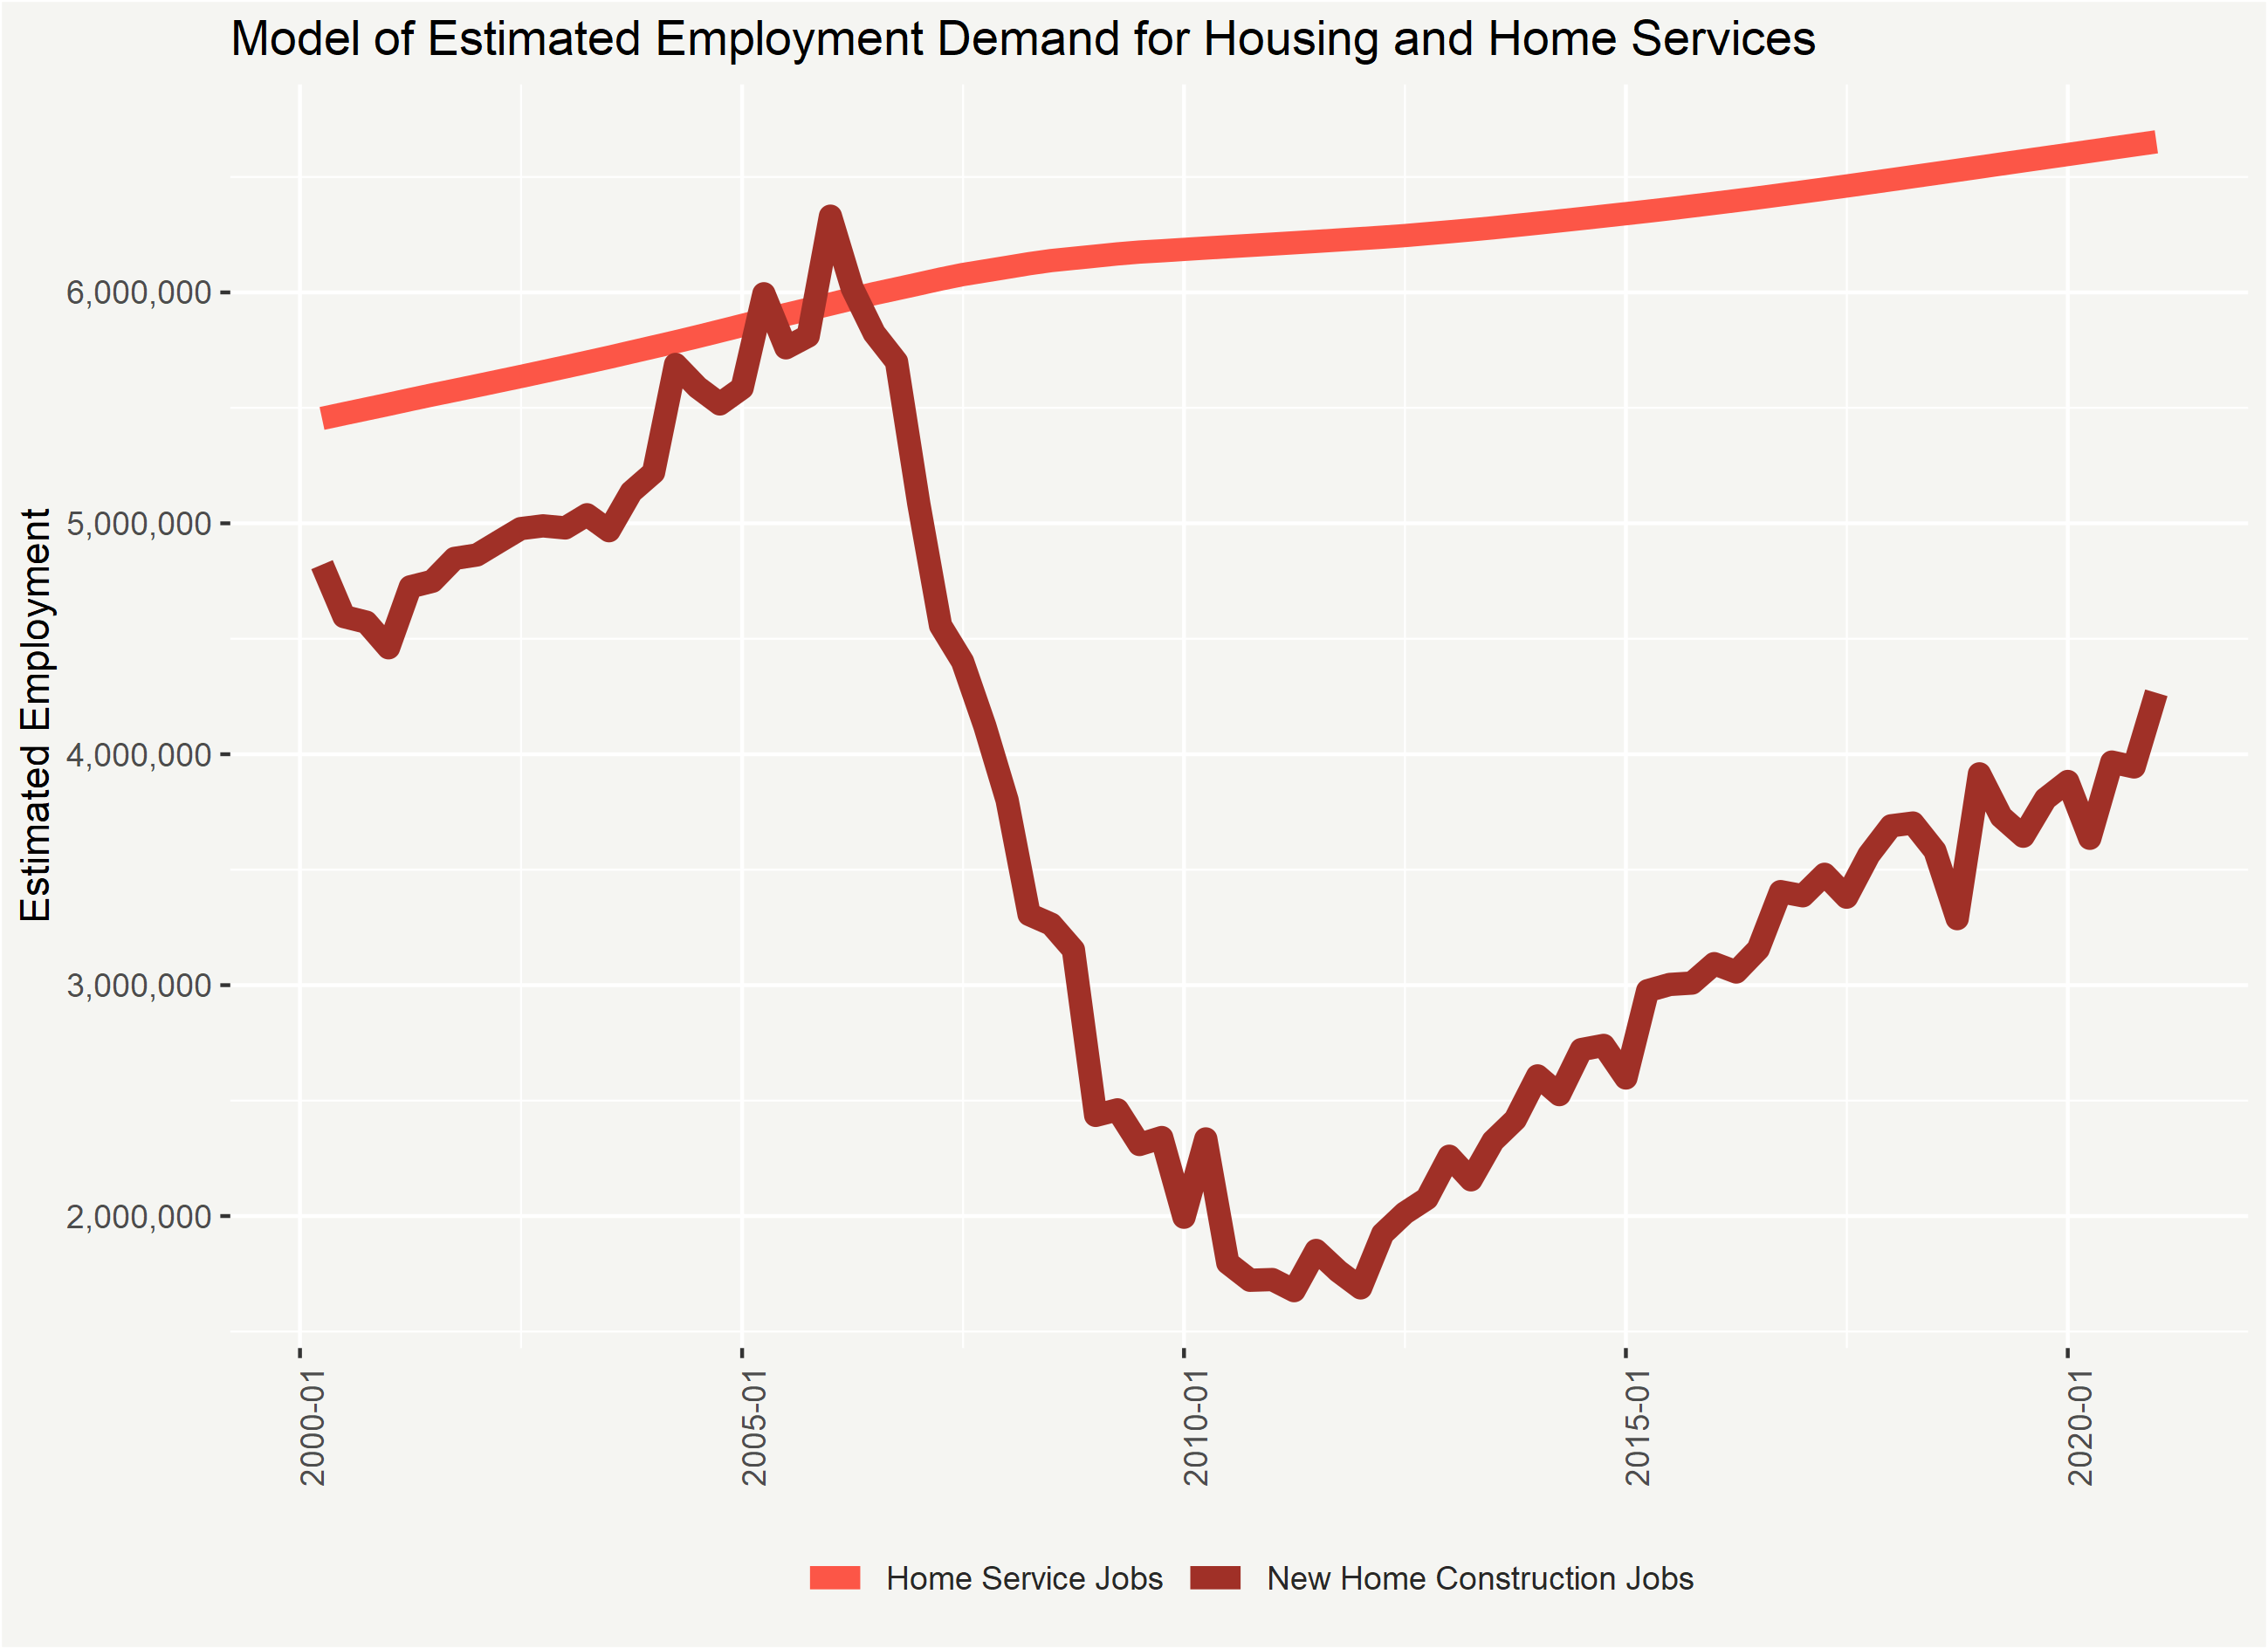
To put these differences into quantitative terms: the construction of a new home generates about three new jobs over the course of a calendar year5, which is significantly more than the 0.04% of a job generated for home service activity for an existing home; however, there are over 100 times as many existing homes as there are new homes, so the number of jobs for the home services market is cumulatively much higher. Furthermore, since the supply of existing homes is very stable year over year, the demand for work to maintain and improve those structures should also be more stable than the demand for home construction workers.
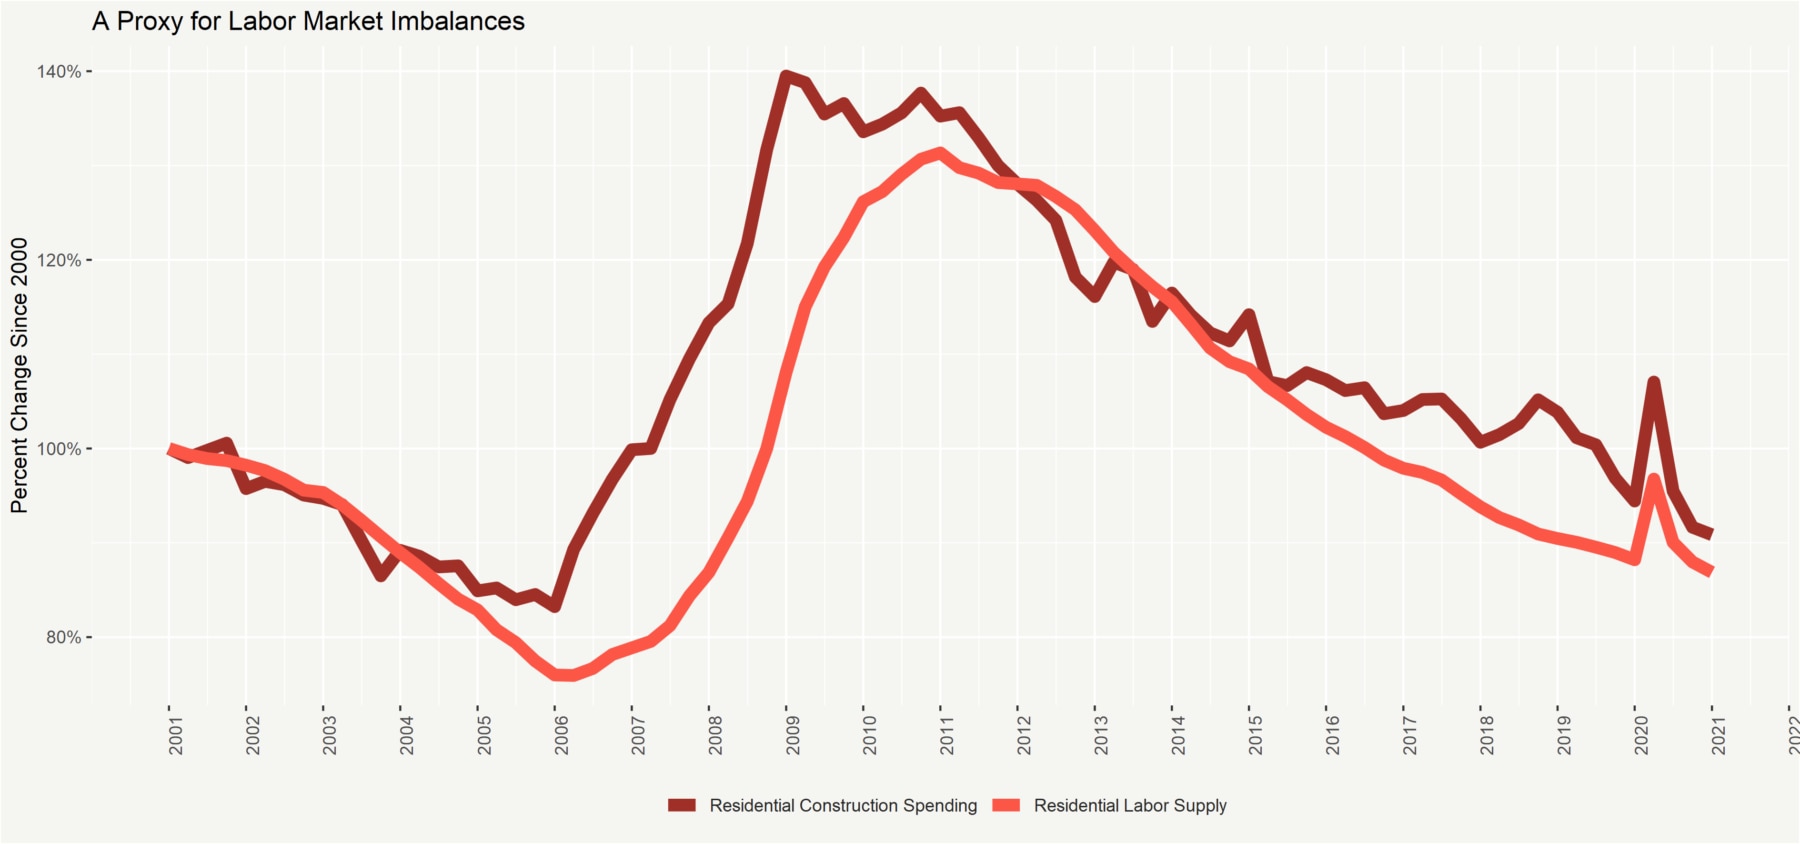
The smooth trend in this model for home service demand may understate moments of elevated demand. For example, maintenance and other demand needs may peak following periods of booming construction when new unproven methods are adopted to save time and cost, or a competitive housing market results in less time for buyers to assess all the defects with what they are purchasing.
Projecting the home service industry’s medium-term outlook, one of the most significant headwinds is labor market supply. The industry benefited in the years following the great recession from a shortage of competition from the housing industry for new home construction, and a surplus of trained workers from the peak of the home building period that found individual tradespeople looking for other forms of work. The current surprise boom has meant an extremely tight labor market for skilled tradespeople, as the industry spent the last decade without the same recruitment channels from high new home building volume, and limited competition for labor.
Forward looking, housing booms typically come to an end at some stage, and as the current crop of companies recruiting heavily into the new home construction start to shed employees, it could mean more individuals seeking work and customers in home service and remodeling.
During an unprecedented year for every sector of the economy, the home services market was fortunately spared many of the worst impacts of COVID-19.
Because individual households pivoted their spending to the home, the market grew considerably. This compounding effect of pivoting to the home, combined with demographics, cheap interest rates, higher materials costs and a rise in home ownership, resulted in 17% growth in the overall market from the start of 2020. Because the prices of certain types of lumber and other commodities necessary to some home service jobs rose by as much as 300%, there is no doubt some of this large growth came from the rise in materials cost. As the supply shocks due to Covid-19 subside, it is possible for the price effect to diminish. However, as a result of overall economy wide inflation, and other demand tailwinds, it does not necessarily follow that the TAM will shrink in 2022.
Summary and Forecast for the Future
Market Forecast
Our 2021 market size estimate is 17% larger than the estimate for 2020, with total spending estimated at $595B and the total number of service requests completed at three quarters of a billion (728M).
But what does the medium- and long-term for the market hold? Demographics, interest rates, home equity, the age of the housing stock and digital migration all are serving as strong tailwinds:
- The two largest population cohorts, Boomers and Millennials, are currently entering stages of life focused on home buying and on aging in place, respectively.
- Interest rates dropped by 30% or more in many cases, resulting in a refinance boom that has left more existing homeowners with cheaper mortgage payments and more disposable income.
- Lower interest rates drove more buyers into the home ownership market, driving up demand for home services both as people transitioned from renting to owning and as households living in smaller structures moved into larger ones.
- The jump in home ownership caused home prices to rise, pushing new buyers down the quality chain and into older homes requiring more work than they would otherwise want. Simultaneously, it gave an unexpected boost in equity to existing homeowners, driving up their sense of wealth and opening-up liquidity to turn home value into home projects.
- The continued migration of our lives from offline to online has the twin effects of (a) allowing more people to live further from city centers in larger households, and (b) pushing a digitally native generation to more seamlessly satisfy their demand for home services by migrating to online subscriptions and project fulfillment.
These five factors will shape the market for the next several years, driving robust spending on home services. Even if economic focus for consumers returns to other sectors of the economy, the existing tailwinds could keep the market growing at a more tempered 3-5% per year, resulting in a total TAM of $670B – $720B by 2025. There are headwinds, of course, such as the cost of materials, supply chains delays, and a pronounced labor shortage, that are all acting as short-term barriers for the market, making project completion harder. However, there is no substitute for home services, so these hurdles will likely serve to stretch out consumer demand and delay project completion, rather than prevent it altogether.
Technical Appendix
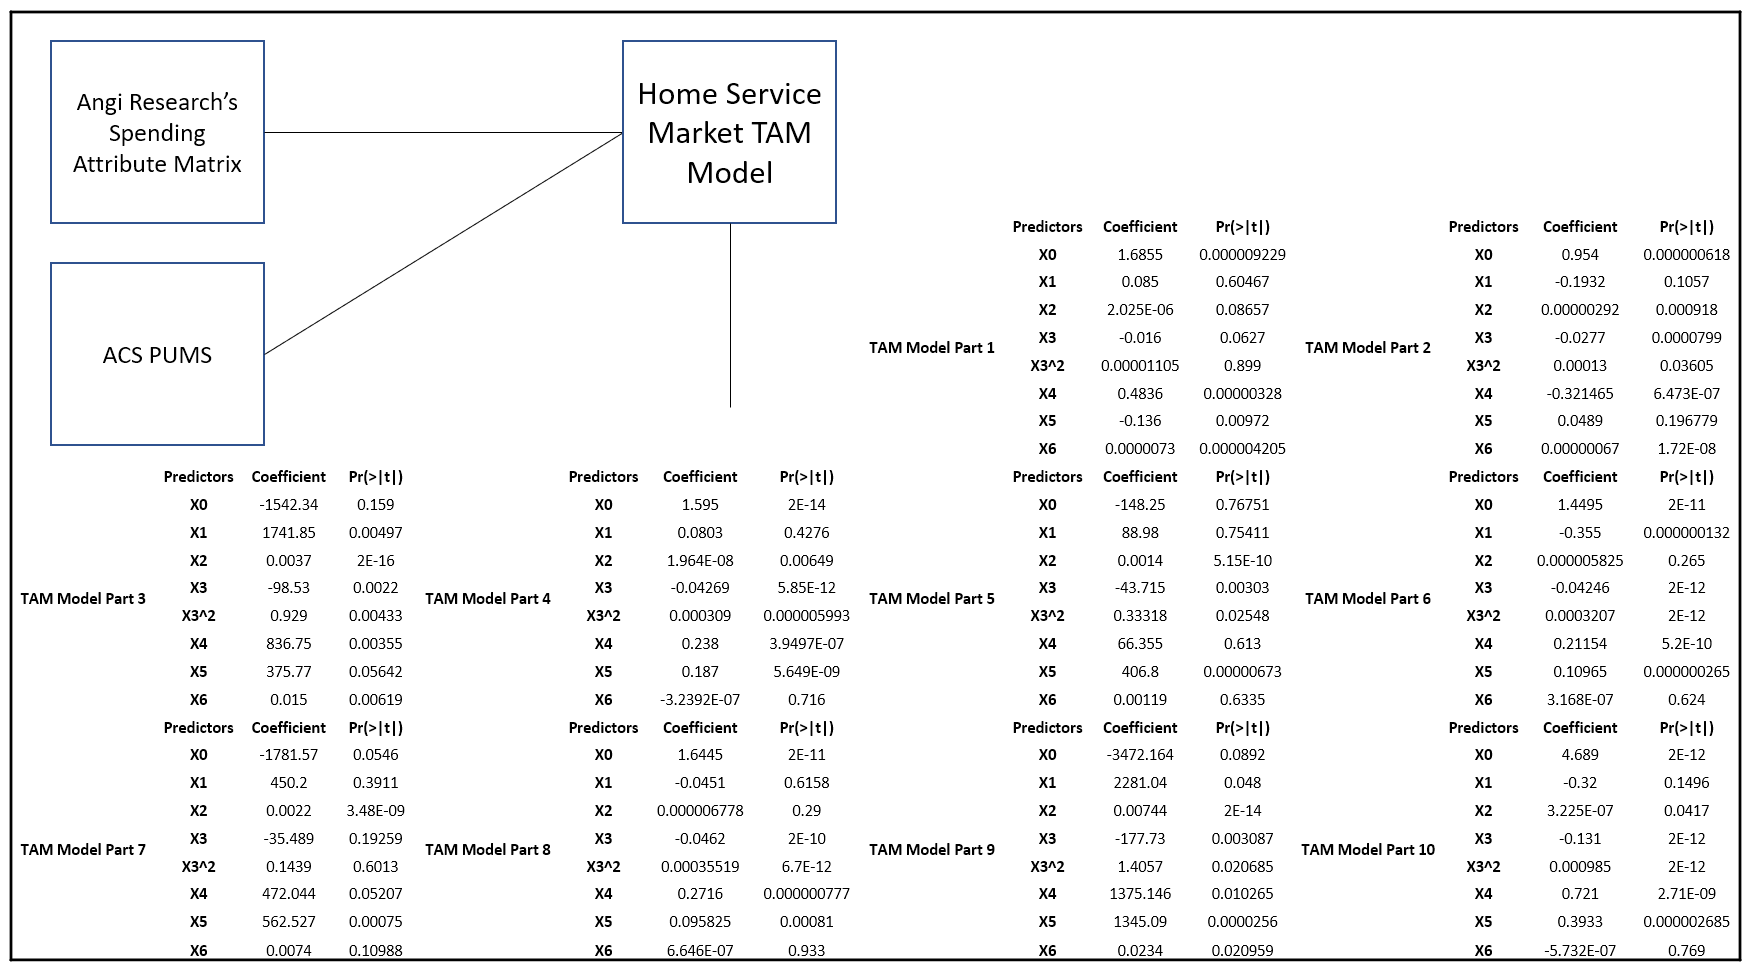
How We Model
Our in-house market size model combines our internal analysis of consumer spending behavior and household attributes with ACS microdata to develop individual spending estimates for every household in the United States. An approximate outline of the coefficients and model attributes are below:
Comparisons to Other Estimates
Other research is produced that also estimates either the home service market, the remodeling market, or some component thereof. Our estimates may differ from those for various reasons. Including, differing scope of what constitutes home service spending, different estimation methods for the total market size, different methods of sample or ACS weights, and different access to updated consumer spending data.
The skilled tradesperson population count in table in section 1.3 includes an estimated share weight. The actuals are unknown and may shift up or down depending on local labor market estimates. Table occupational titles have also been shortened in some cases away from the Census definitions to improve readability.
References
- N=5,000
- https://www.nahbclassic.org/generic.aspx?sectionID=734&genericContentID=272642&channelID=311&_ga=2.31146936.662783200.1621405821-800217389.1617208142
- https://www.corelogic.com/insights-download/homeowner-equity-report.aspx assuming similar equity gains between homeowners with mortgages and the remaining 38% of all other properties.
- https://www.nahb.org/news-and-economics/housing-economics/national-statistics/framing-lumber-prices
- This report uses data from original analysis of the 2019 ACS PUMS, in addition and combination with our internal market estimation model and consumer spending attributes.
Mallory Micetich
Vice President, Corporate Communications
Angi, Inc.
mediarelations@angi.com
Mischa Fisher
Chief Economist
Angi, Inc.
insights@angi.com
 Press & Media Inquiries
 Angi Economics