
Summary:
In 2020 people across the United States began to grapple with a global pandemic, seeking safety in their homes as governments issued “stay at home” orders. In the two years since, many pre-pandemic activities, habits and behaviors have returned. With the rollout of vaccines over the last year, people began to dine out, go to movies, and travel. This year also introduced new financial tumult as inflation continued to rise, interest rates increased, and the markets began to send recessionary signals.
So what does this mean for home services this year? In 2022 did homeowners continue to spend on home improvement, maintenance, and emergency projects? If they did work on their homes, why did they do it? Have motivations for home services spending changed?
Looking at 2022, we see a return to more normal home spending patterns representing an increase in spending and projects from 2019 and a decrease in home services spending and projects from 2021. There was unusually high demand in 2021, and now with the data and insights from this year’s report, we know that 2021 home services spending and projects was likely an outlier.
However, while the total spend across all categories and the number of projects taken on by homeowners in 2022 represents a return to a more normal growth pattern, one thing in terms of home services is proving to be an enduring trend—the motivation for doing work and spending on home improvements.
For years leading into the COVID-19 pandemic this report saw “return on investment” and other financial reasons as the primary factors driving demand for home improvement spending. However, that changed in 2020 when lifestyle considerations like “making your home better suited for lifestyle needs” became the primary motivator.
This trend not only endures but is strengthening each year. This year, an all-time high of 61% of homeowners indicate that lifestyle considerations are the top reason for doing work in their homes. Of those homeowners, 34% say their primary motivation was to “make home better suited for lifestyle needs,” and 27% say their primary motivation was to “get personal enjoyment out of an outdated home.”
So while spending changed this year compared to last year, the reasons why people are taking on the work and the importance we now place in our homes continues to grow. One thing has become certain—the pandemic ushered in a new era of the home.
This year’s State of Home Spending report dives into these dynamics, exploring how people approached home improvement, maintenance, and repair work this year and supplies new insights into consumer behavior as we enter 2023.
Key Takeaways

- Spending across home improvement, maintenance, and emergency repairs decreased between 16% and 18% compared to 2021, however, spending in all categories represents significant increases since 2019. 2021 was a year of unusually high home services activity and this year, 2022, represents a return to more normal home spending growth patterns
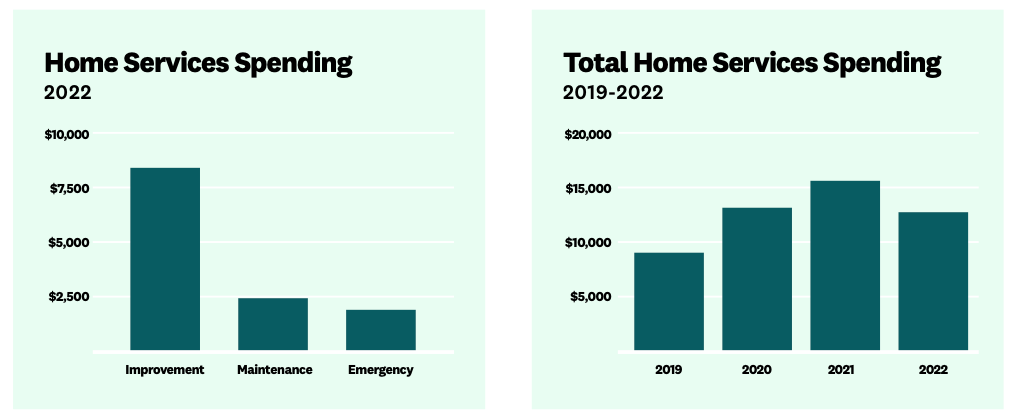
- Across all three categories of home spending—improvement, maintenance, and emergencies— total average spending in 2022 was $12,904 across an average of 12.5 projects. Although this was a decrease in spending from 2021, total home services spending was relatively flat compared to 2020 and increased 42% since our 2019 State of Home Spending report.
- Home improvement spending was $8,484 in 2022. Homeowners who invested in home improvement did an average of 3.2 projects, which was nearly flat compared to the previous years’ number of projects
- Home maintenance spending in 2022 was $2,467. The average number of completed maintenance projects was 7.5, which is in line with the number of maintenance projects in 2020 at 7.48 projects. Homeowners completed an average of 3 landscaping jobs, 2.2 cleaning jobs, and 2.3 other maintenance projects.
- Home emergency spending was $1,953 across 1.8 projects per household.
- The top three most popular projects of 2022 were regular maintenance (38%), such as lawn mowing, gutter cleaning, interior painting (34%), and bathroom remodels (29%). While bathroom remodels and interior painting were in the top three projects for the last two years, this is the first time we asked specifically about maintenance and were not surprised to see it as the most popular project.
- Representing one of the biggest shifts since the start of the pandemic, the top reason for completing a home improvement project was to make the home better suit lifestyle needs, which was the primary reason among over a third (34%) of all households. The second most common reason was to get personal enjoyment out of an outdated home, with over a quarter of homeowners doing work for this reason (27%). Prior to the start of the pandemic, return on investment or other financial reasons were consistently the top motivator for improvement spending.
- Homeowners value their homes now more than before the start of the COVID-19 pandemic (86% said Yes, 14% said No).
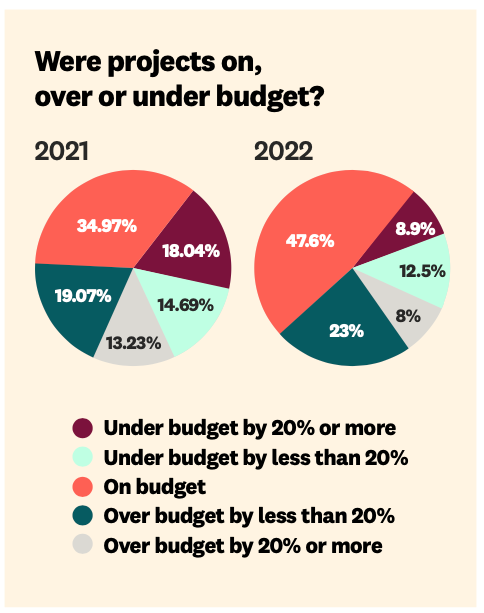
- This year, homeowners managed to stay on budget and on time nearly half of the time (48%). If homeowners did not, the top two reasons for project delays or budget overages were products or materials took longer than expected to arrive(17.6%) and that there were changes to the design plans after the work had begun (14.4%).
- The top two reasons projects were not completed were COVID-19 (13.2%) and financial hardship (10.3%).
- Inflation had a moderate to large impact on homeowner home services spending, with nearly three-quarters (74.5%) of homeowners’ spending impacted by inflation. Inflation also affected the number of projects homeowners took on, with 70% saying it had a moderate to large impact.
PART 1: THE STATE OF HOME SPENDING IN 2022
In 2022 homeowner spending returned to more predictable patterns in line with spending in 2019 and 2020. This year, spending and the number of projects in all categories was either flat or showed a small increase over 2020, representing significant increases since 2019.
This year, homeowners continued to update and make their home suit their needs, but also had other places they were spending money, like travel and entertainment. Looking at what homeowners did, what they spent, and how many projects they took on this year gives us good reason to believe that home services spending in 2021 was an anomaly, and going forward we anticipate a more normal pattern of growth.
1.1 Home Improvement Spending
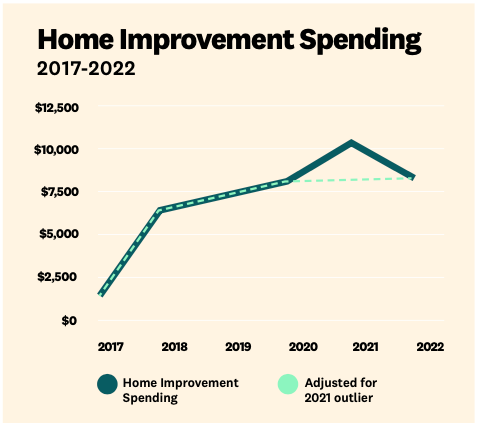
Home improvement spending decreased over the last year by 18% to an average of $8,484 and the number of projects decreased 14%, from an average of 3.7 projects to 3.2 projects per household. In the eight years we have been tracking homeowner spending on home improvement and remodeling, this is the second-highest average spending.
Compared to 2020, home improvement spending rose 2% from $8,305 and the number of projects increased 12.5% from 2.8 projects. Compared to 2019, home improvement spending rose 11%, showing a consistent year-over-year increase, with 2021 representing an outlier.
Why Did Homeowner Spending Decline in 2022?
Although home improvement spending declined compared to 2021, spending actually returned to a much more normal growth pattern. There are two key reasons for this return: inflation and a return to pre-pandemic activities, like entertainment, travel, and commuting.
When we asked homeowners about inflation, a clear trend emerged: inflation was impacting a large majority of homeowners’ improvement spending and how many projects they took on.
Specifically, inflation had a moderate to large impact on home services spending, with nearly three-quarters (74.5%) of homeowners’ spending impacted by inflation. Inflation also influenced the number of projects homeowners took on, with 70% saying it had a moderate to large impact.
Outside of inflation, as pandemic-era safety measures loosened, Americans returned to activities like traveling, dining out, commuting back to offices, and paying for entertainment like concerts and movies. In past surveys, we saw that people took savings from these other areas and added that budget into their homes. This year as these activities gained popularity, we have good reason to believe that homeowners’ budgets were also reallocated.
Do Different Generations Spend Differently?
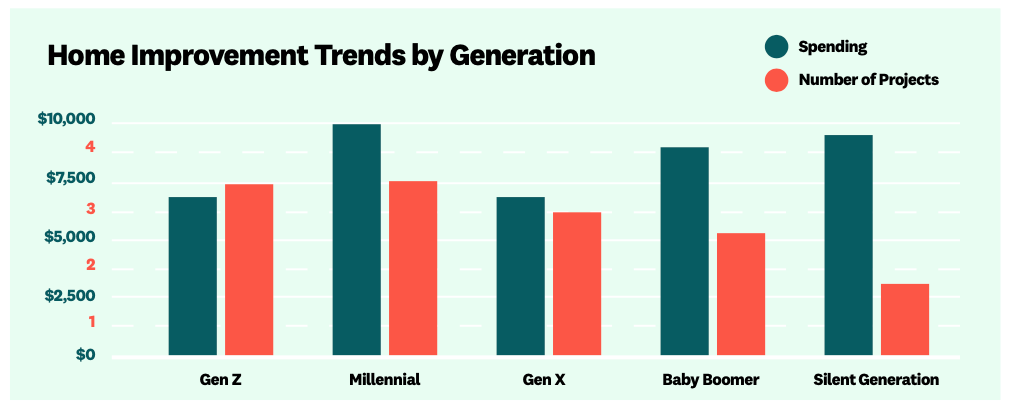
Millennials lead the pack in terms of both spending on home improvement projects and the number of projects they completed, with millennials spending on average $9,958 and completing 3.5 improvement projects. Right now, millennials are in a core home-buying, family-formation mindset. According to the National Association of Realtors, millennials represent 43% of homebuyers in 2022, the highest share of any generation and many researchers are predicting an upcoming millennial baby boom. Buying homes and family formation are key drivers of home improvement activity.
Looking across other generations we see some interesting dynamics. Across the board, Gen X saw lower spending and lower total improvement project volume, compared to millennials, with $7,381 and 3 respectively. Right now, Gen X is too young to begin the work of preparing the home for retirement and too old to be first-time homebuyers or first-time parents.
Baby Boomers took on a lower number of projects this year, but had a decently high spend on those projects, suggesting they are taking on higher price tag projects. This year, Baby Boomers spent $9,092 across 2.6 projects. The silent generation spent the second highest, but took on the smallest number of projects this year, $9,532 and 1.8 respectively, suggesting that while they only took on a few improvement projects, these projects were likely higher-value improvement projects, making the home more livable as they age in place.
Lastly, looking at the youngest generation, Gen Z, we see an interesting dynamic. Gen Z homeowners spent the least of any generation, yet took on as many projects as millennials— $6,638 and 3.5 projects. This suggests that Gen Z is a cost-conscious generation that has an eye toward home improvement affordability more than any other age group. This makes sense as many Gen Z are still working to build their total net worth as they age.
1.2 Home Maintenance and Home Emergency Spending
Home Maintenance
Home maintenance spending declined by about 18% in 2022 compared to 2021, however maintenance spending is still incredibly high compared to pre-pandemic levels. In 2022, homeowners spent $2,467 across 7.5 projects for annual home maintenance. Over the last three years, maintenance spending jumped up 162% on average as people started to spend more time at home due to the pandemic.
As noted in last year’s report, this now three-year trend is particularly noteworthy given the 20% increase in the value of the average home. There is common wisdom that one should budget approximately 1% of a home’s value every year for home maintenance. With the average cost of a home now around $400,000, consumer behavior is adjusting accordingly.
Emergency or Home Repairs
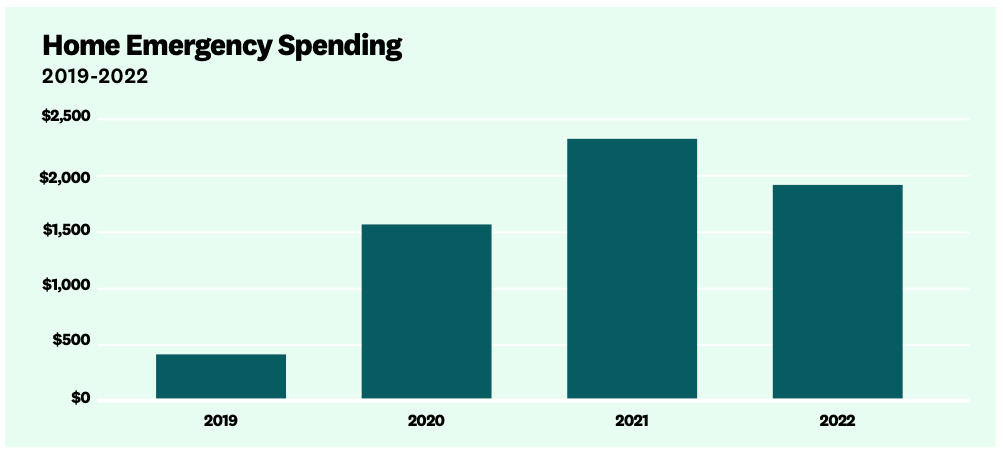
Home emergency spending contracted year over year and stayed on trend with how home spending changed across all spending categories in 2022. This year, homeowners spent an average of $1,953 across 1.8 projects.
While this represents a decrease in spending since 2021, emergency spending had the largest increase across all categories (improvement, maintenance, and emergency spending) in 2021, largely due to expensive natural disasters in the states of Texas, California, and New York. So while spending on emergency home repair declined in 2022, it is similar to spending in 2020.
1.3 Does Extreme Weather Factor Into Projects?
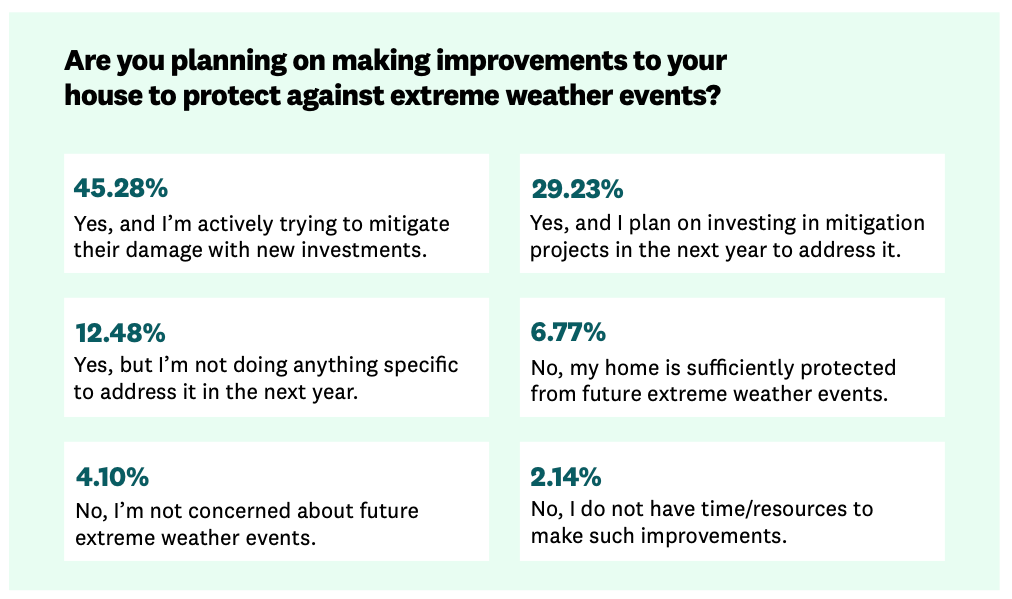
This year, we wanted to better understand the impact of experiencing an extreme weather-related home emergency. We asked homeowners if they had experienced a severe weather event and if that experience encouraged them to take on more weather mitigation projects.
Of the homeowners we surveyed, 40% of them were impacted by an extreme weather event this year. Of those who did experience an emergency, a majority, 74%, are either actively taking on mitigation projects or plan to complete a mitigation project in the next year. As we look towards the future and as more areas of the U.S. experience extreme weather, we anticipate this trend will continue.
1.4 Most Popular Projects of 2022
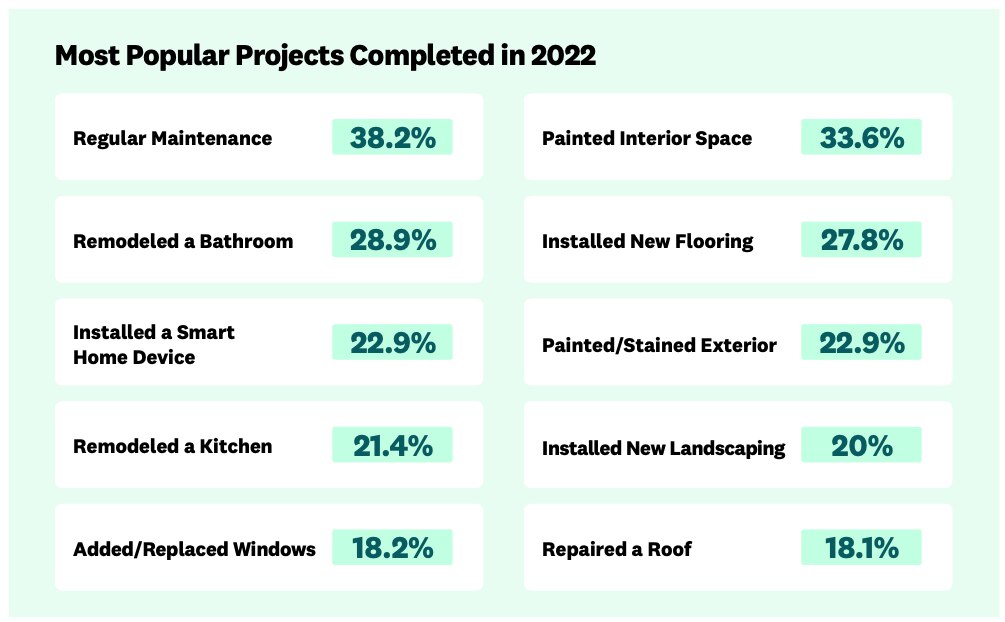
With the increased use and wear and tear on our homes, it was not surprising to see that the most popular project this year was regular home maintenance, with 38.2% of homeowners completing this type of work. Beyond maintenance, the top projects of the year were painting an interior space (33.6%),remodeling a bathroom (28.9%), and installing new flooring (27.8%). This year saw an always popular home renovation,—bathroom remodels—return to the top three after a one-year hiatus.
Many of these projects are considered non-discretionary tasks, specifically maintenance, replacing windows, and repairing a roof. With more budgetary demands from leisure spending and the impact of inflation, it’s not a surprising outcome.
The top 10 projects of 2022
PART 2: HOW THE PANDEMIC CHANGED THE HOME AND HOME SERVICES
While spending trends returned to more normal growth and we began to understand how 2021 was an outlier year when it came to spending, the pandemic ushered in some fundamental changes in how we think about our homes, what motivates us to do work and how we think about the future of home improvement spending.
At Angi, we have seen a shift in how people value their homes. The pandemic brought a new appreciation and meaning to our homes as they quickly became a more central part of our lives.
In fact, 86% of homeowners polled value their homes now more than before the start of the pandemic. This is the first time we specifically asked homeowners if they value their home more and the results show a clear value shift. This shift in value informs not only what motivates the work we take on but what we plan to do in the future, which we will discuss more later in this report.
2.1 Project Motivation
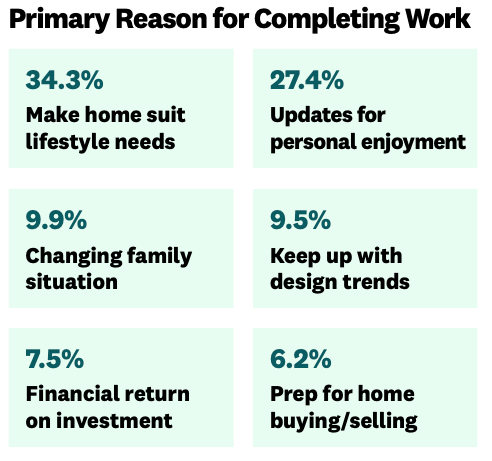
As mentioned earlier in this report, people are taking on home improvement projects for lifestyle reasons, which is a persistent trend brought about by the pandemic. Even as spending on things outside the home, like entertainment, travel, and inflation, puts more pressure on homeowners’ improvement budgets, the reason for the work has not changed.
2.2 Delays and Hurdles
Over the past three years, COVID-19 delays and material shortages were two of the biggest hurdles to starting work and completing projects. In 2022, we saw COVID-19 and material disruptions decline by half, from 26% in 2021 to 13% in 2022, for COVID-19 disruptions and from 22% in 2021 to 9% in 2022 for material delays.
This year, more than 20% of homeowners did not have any projects that went unfinished. If projects were unfinished, the top five reasons for not completing the work were: COVID-19 disruptions (13%), financial hardship (10%), materials were not available or too expensive (9%), they had to prioritize other emergency or unplanned home projects (8%), and the person they wanted to do the work was too busy (8%).
Although financial hardship ranks as the second most common reason for not completing work this year, fewer homeowners are citing this as a reason for incomplete work compared to last year. In 2021, 16% of homeowners said that financial hardship was the reason for not completing projects, compared to 10% this year. Overall, we saw more people completing all work and a close distribution of all reasons for delayed work compared to last year.
This is a good thing for homeowners wanting to do work next year, as illness, labor and material shortages become less of a problem since 2020, when supply chain issues, material shortages and labor were impacted by the pandemic.
We see this trend when it comes to projects staying on time and on budget as well. In 2022, 48% of homeowners stayed on budget for all projects they completed, compared to just 34% in 2021.
If people experienced delays or went over budget, top reasons included: products or materials took longer than expected to arrive (17%), there were changes to the design plans after the work had begun (14%), hidden surprises (structural issues, termite damage or outdated electricals) (12%), the contractor took longer than promised to finish the work (12%), and lastly, delays or unexpected issues with permitting (9%).
Compared to 2021, this year, material delays caused less hold ups or budget issues (22% compared to 17%, respectively), once again showing that COVID-19 era disruptions are easing.
We also wanted to know how homeowners think and feel about the relationship between their current homes and the work they need to do to be content with their homes. We found that nearly 75% of homeowners are content with their homes, but plan on either doing consistent maintenance style projects (42%) or making some investments and taking on a few big projects (29%). Only 5% of homeowners are not happy with their homes and plan on taking a lot of improvement and repair work over the next few years. While 24% of home- owners are satisfied with their homes and do not think it needs work. An overwhelming majority of homeowners (95%) are content with their homes, even if those homes do require work. This further demonstrates how the home has become an even more central part of our lives.
2.3 Where Do Homeowners Turn for Inspiration
In 2020 we not only saw a global pandemic takeover, but we also saw a TikTok takeover. At Angi, we were curious about where homeowners turn for inspiration given our current era of ever-present social media, influencers, and traditional media.
When looking at inspiration sources across all ages, TV lifestyle media emerged as the top source of homeowner inspiration. This includes channels like HGTV, DIY Channel, and Magnolia Network. This was closely followed by search engines and Pinterest. The lowest-ranked source of inspiration, for all ages, was influencers.
However, looking at this by generation, a different picture emerges. Ages 18 to24, primarily Gen Z, highly favor TikTok (51%) as their number one source for home improvement inspiration, followed by Instagram, Pinterest, and Lifestyle TV media. These young homeowners turn to print or online media the least for inspiration.
As soon as we move into the next age category, 25 to 34, the top choice for inspiration shifts to lifestyle TV media. However, nearly all of the inspiration sources are very closely bunched and outside of lifestyle TV there are no other clear standout sources. TikTok, Instagram, Pinterest, local social networking sites, and search engines all rank closely. Influencers are the lowest-ranking source. These younger millennials are turning to new media, social media, traditional media and local sources, consuming the widest range of inspiration sources.
Looking at older millennials and young Gen X, ages 35 to 44, another big shift happens. Search engines emerge as the top source (44%) for inspiration, closely followed by lifestyle TV (43%).Tiktok takes a dive, with only 26% of homeowners in this age group turning to that source, thoughInstagram and Pinterest are also popular choices. Influencers rank lowest, with only 18% turning to them for inspiration.
This drop off in TikTok continues for all remaining ages and generations. Gex X, ages 45 to 54, overwhelmingly turn to lifestyle TV for inspiration (52%) and then turn to search engines (40%) and Pinterest (30%). For Baby Boomers, lifestyle TV (46%) is the top inspiration source, followed by search engines (43%). Boomers are the first generation with a significant drop off in Instagram as an inspiration source (10%) and turn to TikTok the least (7%). Baby Boomers are also least likely to look towards influencers (6%).
PART 3: LOOKING FORWARD – WHAT DO HOMEOWNERS WANT TO DO IN 2023?
Now that we know what projects homeowners did in 2022, how much they spent, and how many total projects they completed, we’ll pivot and focus on 2023.
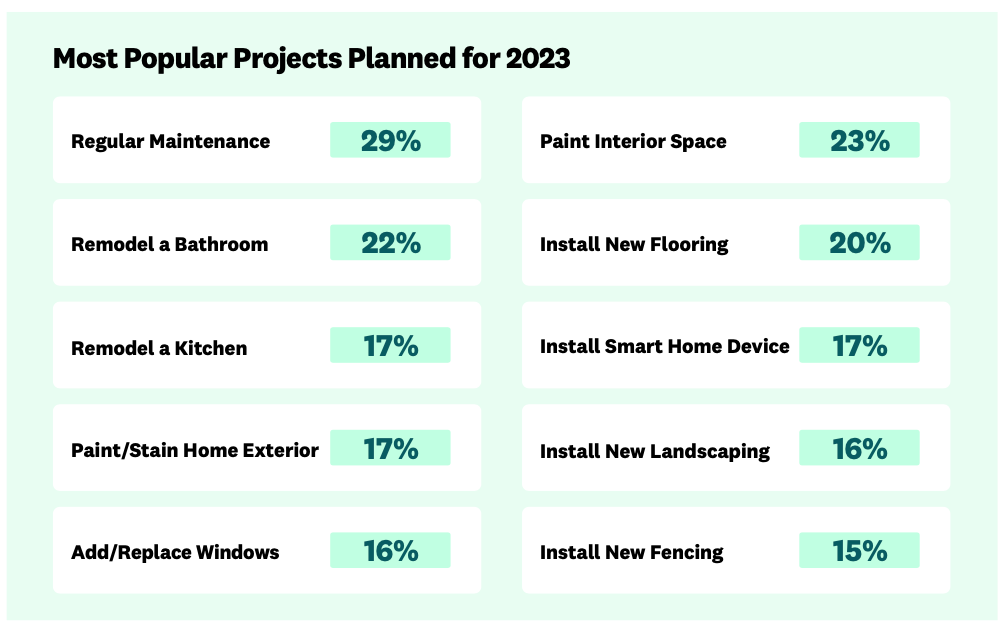
Which Projects Do Homeowners Plan to Complete in the Next 12 Months?
Maintenance, maintenance, and more maintenance is on the horizon. Home projects such as lawn mowing, cleaning, landscaping, and other routine maintenance top the list. As homeowners continue to spend time and put value into their homes, keeping homes running is top of mind. Other high-priority projects include interior painting, bathroom remodels, and new flooring.
3.1 Which Projects do Homeowners Plan to Complete in the Next Five Years?
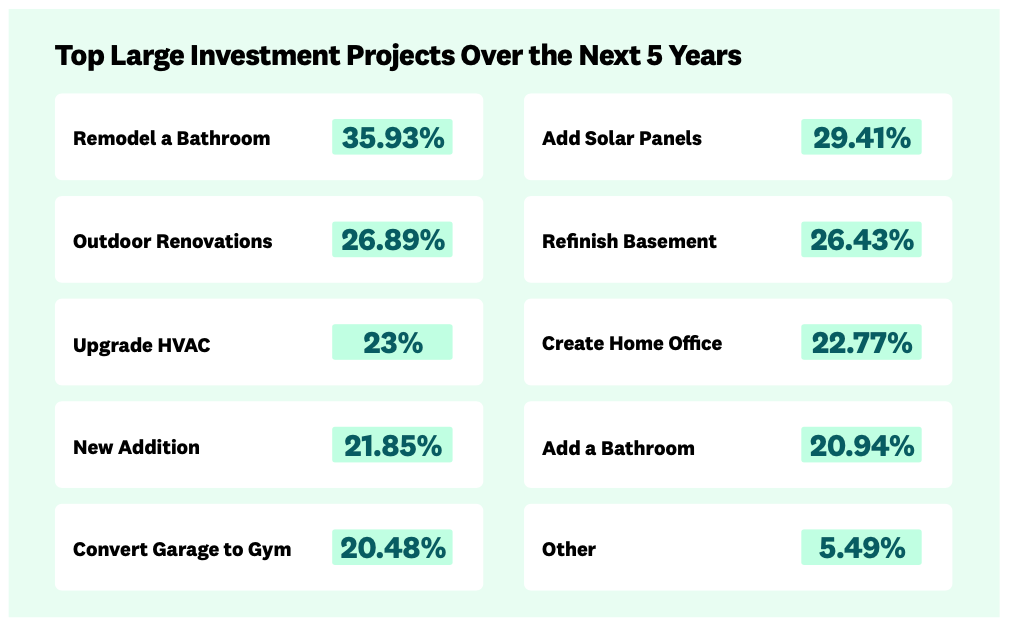
Does looking across a longer horizon change what projects homeowners plan to take on, especially when it comes to bigger investment projects?
Of the homeowners we surveyed, more than 60% plan on making additional large investments in their homes over the next five years. Bathroom remodeling was the top choice (36%), followed by adding solar panels (29%) and then major outdoor renovations (26%). But there is a strong desire to do many major projects over a longer horizon.
When homeowners have more time to plan and budget, the desire to do more substantial work grows.
For projects that were not completed, COVID-19 was still listed as the primary reason, accounting for over a quarter (26%) of all uncompleted projects. The second most common reason was projects being too expensive, accounting for 22% of all incomplete projects. Together, this means that as material prices return to Earth, supply chains stabilize and the pandemic wanes, nearly half of this year’s barriers to project completion will potentially disappear, resulting in even more growth in demand for home projects.
3.2 How Will Rising Interest Rates Factor Into Homeowner Spending Next Year?
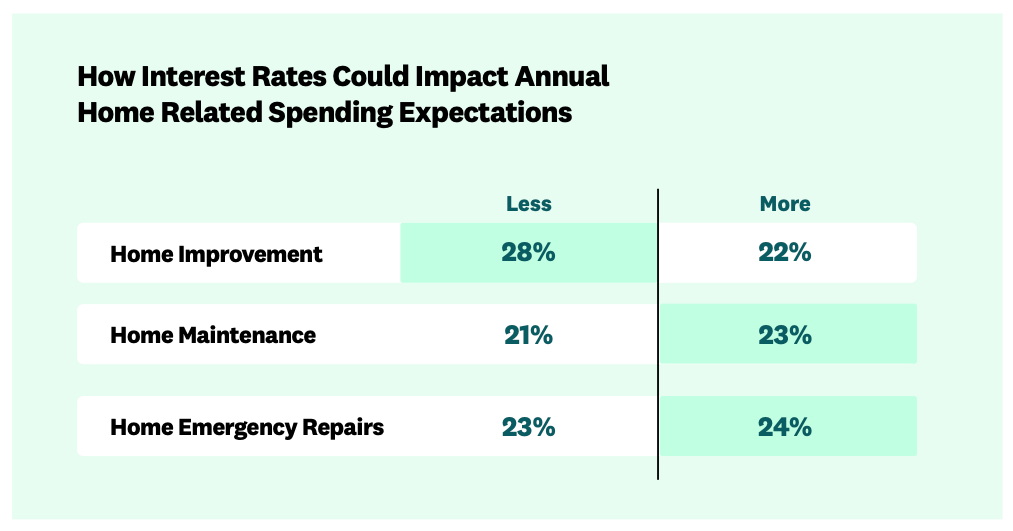
Lastly, we wanted to know if, and,or how rising interest rates would impact home improvement, maintenance, and repair spending over the next year.
Surprisingly, despite the near-constant news about rising rates, homeowners largely anticipate spending the same amount next year on improvement, maintenance, and repairs as they did this year; home improvement (50%), home maintenance (56%), and home emergency repairs (54%).
For nearly the same percentage of homeowners, interest rates have changed home spending expectations upward or downward. So while interest rates are consistently in the news, they are not dramatically impacting anticipated homeowner spending.
Methodology
The State of Home Spending is based on Angi analysis of surveys fielded to 6,500 consumers on October 21st, 2021. The full sample consists of a survey of the general population (n=5,000) and a survey of homeowner households that completed a remodeling project in the last 12 months and hired someone else to do at least some of the work for them (n=1,500). The general population survey was post-sample weighted to balance the sample against general population statistics for age, gender and income to determine average spending and project volume. All statistics, unless otherwise noted, refer to homeowner households that completed an improvement project.
US Population Estimates: https://www.census.gov/quickfacts/fact/table/US/PST045219
Contacts
For information about this report or other research or analysis questions, you can contact the Angi Research team:
angi.com/research
Mallory Micetich
Vice President, Corporate Communications
Angi
mediarelations@angi.com

 Press & Media Inquiries
 Angi Economics