Do you need more parking for your business or home? Here's everything you need to know about the cost to pave a parking lot.

The average lot size by state varies dramatically, with Vermont leading at 78,408 square feet while Nevada has the smallest at just 7,405 square feet.
Rural Northeastern states have the largest lots due to minimum lot size zoning laws, while newer developments in fast-growing areas feature smaller parcels to accommodate population growth.
Your property costs depend on both land price per square foot and lot size, so affordable land with large lots can still create high home prices.
Hiring a local real estate agent provides reliable guidance on lot sizes and pricing trends in your area, helping you find the right property for your budget.
Recent trends in the U.S. housing market have led to a downsizing of the American Dream. While many Americans aspire to a home with a large, well-manicured lawn surrounded by a white picket fence, in recent years, lot sizes have been shrinking alongside a crunch in the supply of available land and an influx of young buyers.
According to data from the U.S. Census Bureau, the average lot size for a new single-family home fell from 18,760 square feet in 1978 to a record low of 13,896 square feet in 2020.
While the average lot size has dwindled in recent decades, there is a wide variation in lot sizes across the country. In dense cities with skyrocketing property values, residents make do with lots a fraction of the size of those in more rural areas. Meanwhile, in other parts of the country, minimum lot size zoning laws preserve large tracts of land and prevent developers from subdividing neighborhoods into small plots for row houses and shotgun houses. So, where in the country should you buy a property to ensure you get the biggest lot for your buck? Home experts at Angi have created the Lot Size Index to answer that exact question.
To determine how lot sizes vary around the country, Angi reviewed 393,312 listings of houses for sale from the real estate marketplace Zillow.
We aggregated listings data by state and metropolitan statistical area according to boundary definitions from the U.S. Census Bureau. Listings with no data on lot size, price, and city were excluded from consideration, leaving us with 312,456 listings with available data.
The data was cleaned using the DBSCAN clustering algorithm. Only metropolitan statistical areas with at least 500 Zillow listings were included in our analysis. The data was collected in May 2022.
The largest lot sizes are in the New England states of Vermont, New Hampshire, and Maine.
Newer homes tend to have smaller lot sizes. In Nevada, the typical lot is just 7,405 sq. ft., the smallest of any state. Some 34.6% of homes in Nevada were built in 2000 or later, the largest share of any state.
Large lots can create affordability issues for potential homebuyers. While Fayetteville, AR, has the second cheapest residential land per square foot, large lot sizes make the typical home among the most expensive of any city.
Cities with urban growth boundaries that limit development beyond city borders, like San Jose, Miami, Seattle, and Portland, have small, expensive lots.
Several factors can dictate how large the average plot of residential land is in a certain state. In many parts of the country, strict zoning laws establish minimum lot sizes meant to accommodate essential infrastructure in rural areas like septic tanks or drinking wells.
In Vermont, for example, many municipalities have enacted minimum lot size zoning laws to protect natural habitats and keep land open for agriculture and forestry. Many towns have specially zoned large-lot rural districts, where lots must be between 25 and 50 acres. In Vermont, the median lot size is 78,408 square feet, more than 10 times the median lot size in Nevada and by far the largest of any state.
In Maine, a statewide zoning law dictating that any lot with a septic tank must be at least 20,000 square feet drives up the size of the average property parcel. The median lot size in Maine is 45,738 square feet, the third most of any state.
Wondering how your city compares? Explore our handy comparison tool and quickly see how lot sizes vary from state to state and city to city.
Potential homebuyers looking to purchase a home with a lot of land may have the best luck in the rural Northeast. The three states with the largest median lot size—Vermont, New Hampshire, and Maine—are in New England, where minimum lot sizes prevent developers from subdividing tracts of land into small, dense housing.
In other parts of the country, large lots may be the product of low population density. In Alaska, for example, there are just 1.3 people per square mile, the lowest population density of any state. The typical lot in Alaska is 42,423 square feet, the fifth-largest median lot size of any state.

Lot sizes also depend on the year the home was built. While median lot size has declined in recent years, many homes built in earlier decades were built on lots smaller than today’s standard. In Massachusetts, for example, the typical home was built in 1961, 17 years prior to the U.S. median. The typical lot in Massachusetts is 19,166 square feet, one of the larger median lot sizes of any state.
Conversely, in Nevada, the typical lot is just 7,405 square feet, the least of any state. The typical home in Nevada was built in 1994, 16 years after the U.S. median. Some 34.6% of homes in Nevada were built in 2000 or later, the largest share of any state.
In many of the country’s large, fast-growing cities, developers have had to build smaller and smaller lots to accommodate the influx of new residents. In San Francisco, for example, the typical lot is just 6,098 square feet—the second smallest of any metropolitan area. In San Jose, an urban growth boundary requires all new growth to occur within Santa Clara County, preventing urban sprawl and necessitating smaller lots. The typical lot in San Jose is 6,872 square feet, the fifth smallest of any metro area.

Lot sizes play a large role in the price of housing. According to data from the National Association of Home Builders, lot values account for 21.4% of home sale prices on average. Large lots can lead to high home prices, causing affordability issues where large plots of land are the norm. In Bridgeport, CT, for example, the typical lot is 43,560 square feet—the largest of any metro area. The typical home in Bridgeport is worth $433,000, nearly twice the U.S. median home value and among the most of any metro.
The supply of available land and demand for housing determines the cost of a parcel of residential property and varies across the United States. At the state level, the cost of residential land ranges from $5.71 per square foot in Mississippi to $110.86 per square foot in Hawaii. In general, land is most expensive in the West and Northeast, while land in the South and Midwest is most affordable.
Explore the graphic below to see how the cost of land per square foot varies from state to state.

States with the largest lots tend to have the least expensive land. In Vermont, for example—which has the highest median lot size in the country—plots with residential properties on them sell for just $5.95 per square foot, the second least of any state. In Nevada—home to the smallest median lot size in the country—the typical home and surrounding plot sells for $82.80 per square foot—the third most of any state.
Many of the cities with the most expensive land are fast-growing metro areas where the demand for new housing is high and supply is limited. In San Jose, Miami, Seattle, and Portland, for example—where the cost of land per square foot is among the highest in the country—urban growth boundaries prevent residential development outside the city borders and limit the supply of already in-demand housing.
Meanwhile, cities with the least expensive land have low demand for housing and slow to negative population growth. In Flint, MI, for example, the typical home and surrounding plot sell for just $10.60 per square foot—the least of any city in our analysis. From 2010 to 2021, the population of Flint fell 4.9%, the largest decline of any major U.S. metro area.
Explore the graphic below to see how the cost of land per square foot varies from city to city.
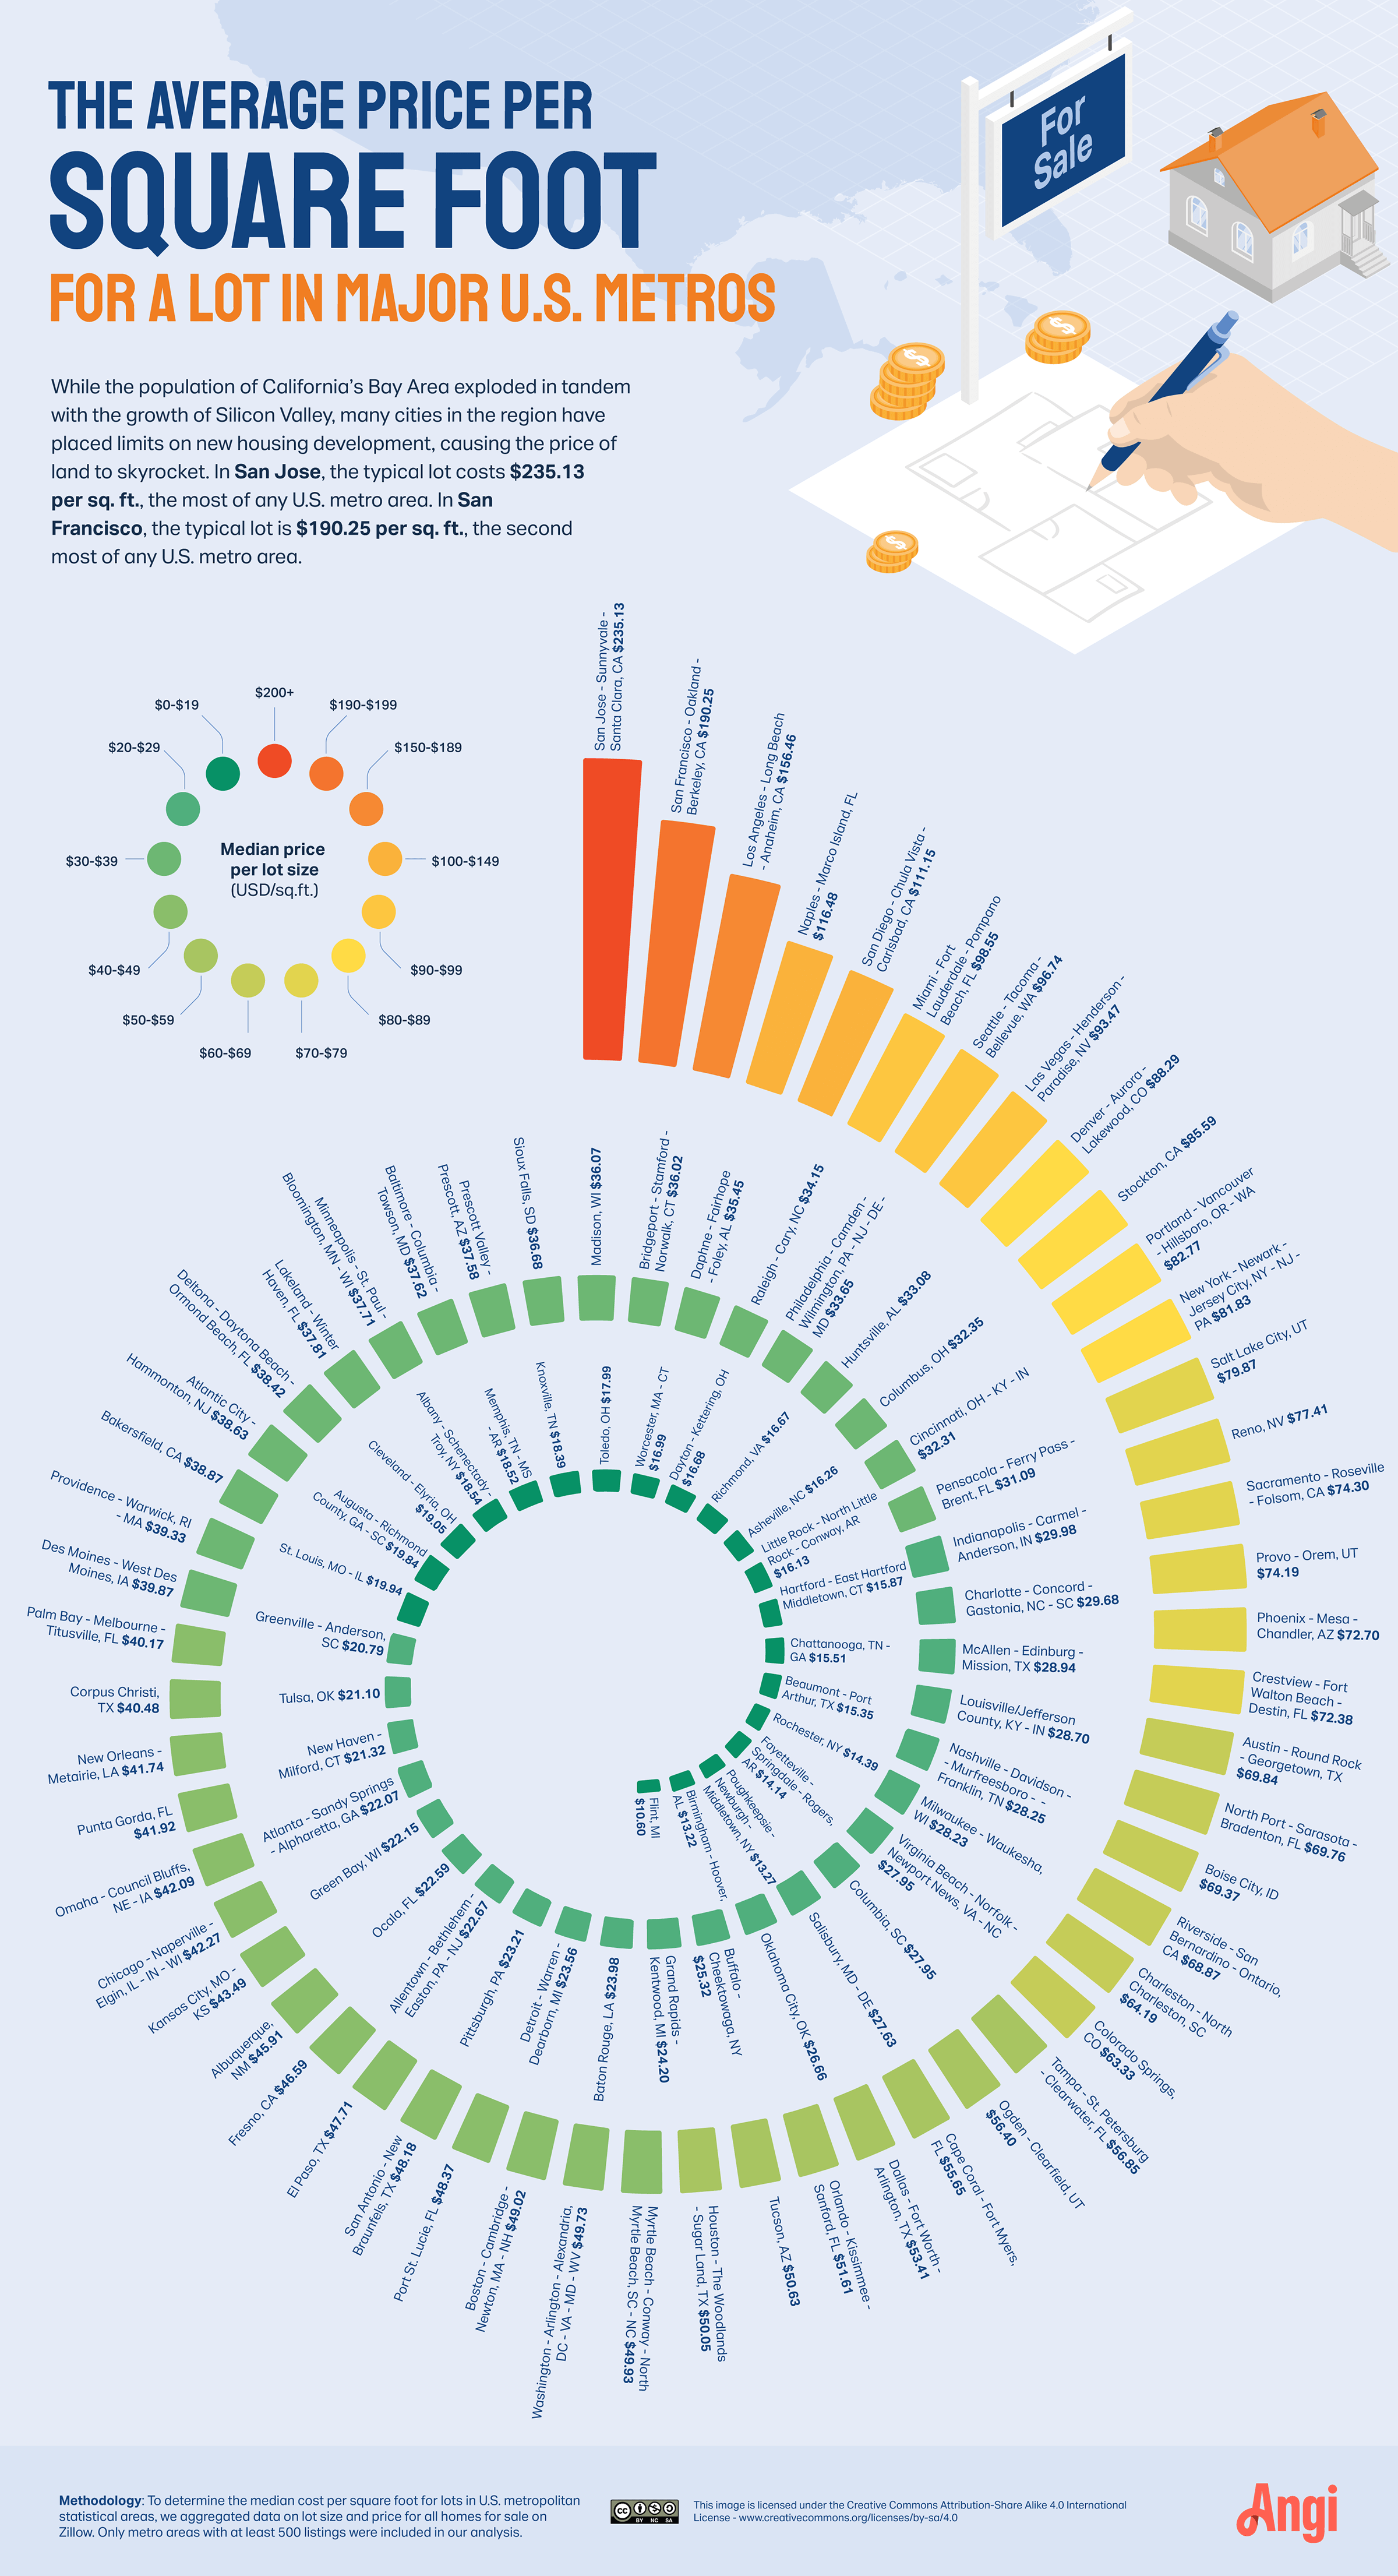
Large lot sizes can price people out of the housing market and create affordability issues for potential homebuyers, even in areas with relatively cheap land. In Fayetteville, AR, for example, the typical home and surrounding plot of land sells for just $14.14 per square foot—the fourth-least of any major metro area. Coupled with the city’s large median lot size, however, the cost of a typical home comes out to $588,318—among the most of any metro area.
Conversely, while land in El Paso is relatively expensive, small lot sizes make the typical property relatively affordable. The typical residential plot in El Paso sells for $47.71 per square foot, on the higher end of all metro areas. Coupled with the city’s small median lot size, however, the price of the typical home comes out to just $290,950—among the least of any metro area.
In general, rural states in the Northeast have the largest lots. Large lot sizes are facilitated by minimum lot size zoning laws, cheap land, and low population density. Meanwhile, in states with smaller parcels, small lot sizes are largely the product of expensive land and newer subdivided housing development.
While cities tend to have higher density development and smaller lots in general, there are some metro areas where city residents live on the same size lots as residents of more rural, undeveloped parts of the country. In Bridgeport, CT, for example, the typical lot is 43,560 feet—roughly in line with the median size of lots in Alaska and Montana.
If you want to explore our full data set, check out our interactive table to see how lot sizes and prices vary throughout the United States.
Since 1950, the share of the U.S. population living in cities has grown from 65% to roughly 83% today. As more Americans opt for big cities, they must also opt out of the American Dream staple of a large suburban home with a sweeping backyard and white picket fence. Lot sizes have gotten smaller in recent years, reaching their lowest levels in high-demand, limited-supply housing markets like San Jose, San Francisco, and Portland. While the largest lots are in municipalities with minimum lot size zoning laws meant to preserve low-density neighborhoods and protect natural areas, many cities are also repealing their minimum lot size rules to make way for new, affordable housing development. In a booming housing market, with growing construction and skyrocketing home prices, knowing the size and price of residential lots around the country is an important asset for the developer, investor, and average reader alike.
To determine the median lot sizes and lot prices for U.S. states and metro areas, we reviewed 393,312 listings of houses for sale from the real estate marketplace Zillow.
We aggregated listings data by state and metropolitan statistical area according to boundary definitions from the U.S. Census Bureau. Listings with no data on lot size, price, and city were excluded from consideration, leaving us with 312,456 listings with available data.
The data was cleaned using the DBSCAN clustering algorithm. Only metropolitan statistical areas with at least 500 Zillow listings were included in our analysis. The data was collected in May 2022.
This company does it right. Firstly, I want to say that Landan was a joy to work with. He was so kind, transparent, and had everything under control. His entire team showed up ready to work and they were all very respectful of the fact that we were in an office space. A little backstory – we...
Great communication throughout from discussion of the project, and its options, to installation. They found a number of unforeseen challenges when mounting my TV and soundbar to, what was found as, an untraditional wall that didn’t allow for wires to be hidden behind the wall. The team was...
Couldn't ask for a better company. Josh and Dee were Very professional, efficient, courteous and takes major pride in their work. They will travel to come to your home and will still give you a fair price. They are honest and trust worthy. Their focus is on their work and their work is...
 Supreme brick & chimney
Professional and great to work with. Reliable, detail-oriented and knowledgeable. Will hire again in the future!
Custom Paint Jobs LLC took our exterior from drab to fab! We couldnt be happier.
The guys at PaveWay are top notch. From the estimate to the job being completed,all was done in a timely and professional manner. I myself was a DOT Engineer Inspector(know what to look for) and got to talking with Cameron and he himself was a Contract inspector for a few years,same job as...
 All Star Paving and Sealing
Before choosing a real estate agent, we conducted a lot of research to see who would be the best choice. Homes that Click stood out as the best Columbus has to offer: their rankings are excellent, their social media presence was strong, and I could tell they put a lot of work into their...
 Homes That Click Realtors
I have witnessed Mary Goodwin's knowledge, determination, and persistence in real estate and the way she professionally guides her clients throughout the home buying process. I am in the early stages of looking for a home, but already feel confident in the process with Mary leading the way.
 Ed Huck Team
Called Mark on a Thursday morning. Not really knowing if he could help me or not. I was having driveway, flooding issues due to a clogged channel drain and I was trying to figure out what direction to take. Heavy rains had come on Monday and again on Thursday leading to flooding in my garage...
These guys are the real deal! Their pricing was definitely competitive and fair; nothing really to write home about. But when it came to attitude and installation they knocked it out of the park. I had 3 estimates and while one was similar $$ to Eco's, the can-do and professionalism Steve...
 Eco Glass Designs
From average costs to expert advice, get all the answers you need to get your job done.
Do you need more parking for your business or home? Here's everything you need to know about the cost to pave a parking lot.

Wondering how much it costs to stripe a parking lot? Learn about average prices, key cost factors, and tips to save on your next parking lot striping project.
Knowing standard kitchen dimensions can ensure you have enough space allocated for this important room. Learn more about the average kitchen size and what affects it.

Building new construction or planning on expanding your living area? Learn about average basement sizes, how to measure, and what size is right for you.
Dumpsters are a convenient way to get rid of large amounts of trash or debris. Learn what size dumpster is right for your project.

Swimming pools come in many sizes, but this pool size chart will simplify your choices and give you tips on how to choose the perfect size for your space.